
🕑 5 min read
USD.AI’s governance token is CoinGecko’s #1 trending coin — but its tokenomics mirror the low-float pattern that wiped $6.6 billion from RaveDAO.
$700 million in 24-hour volume. $157 million market cap.
That’s a 4.46x ratio — the kind of number you normally see on leveraged meme launches, not on a protocol that tokenizes NVIDIA GPUs as loan collateral. The CHIP token, which powers GPU-backed lending protocol USD.AI, hit its all-time high within hours of going live and landed at #1 on CoinGecko’s trending list.
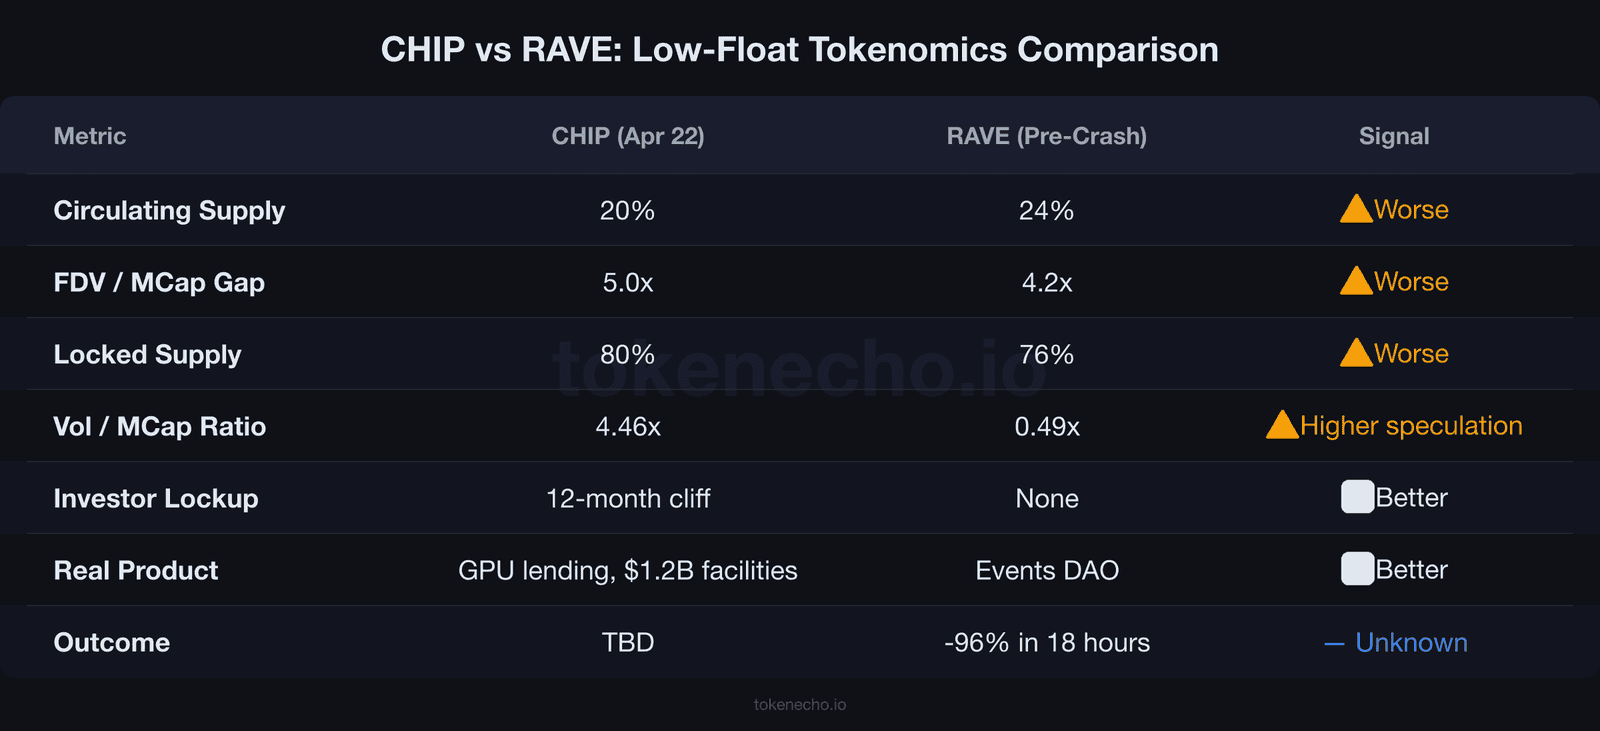
Only 20% of CHIP’s 10 billion tokens circulate right now. The remaining 80% stays locked behind vesting schedules.
We flagged this exact pattern with RaveDAO eight days before it crashed 96% in 18 hours.
Key Takeaways
- CHIP hit ATH ($0.081) on launch day with $700M in daily volume — 4.5x its entire market cap. Only the most speculative launches produce that ratio.
- Just 2 billion of 10 billion tokens circulate. Investors and core contributors hold the rest behind a 12-month cliff, then a 33% unlock followed by 24 months of linear vesting.
- RAVE had nearly identical tokenomics (24% float, 4.2x FDV gap) before insiders deposited tokens on exchanges and the price collapsed 96% in 18 hours.
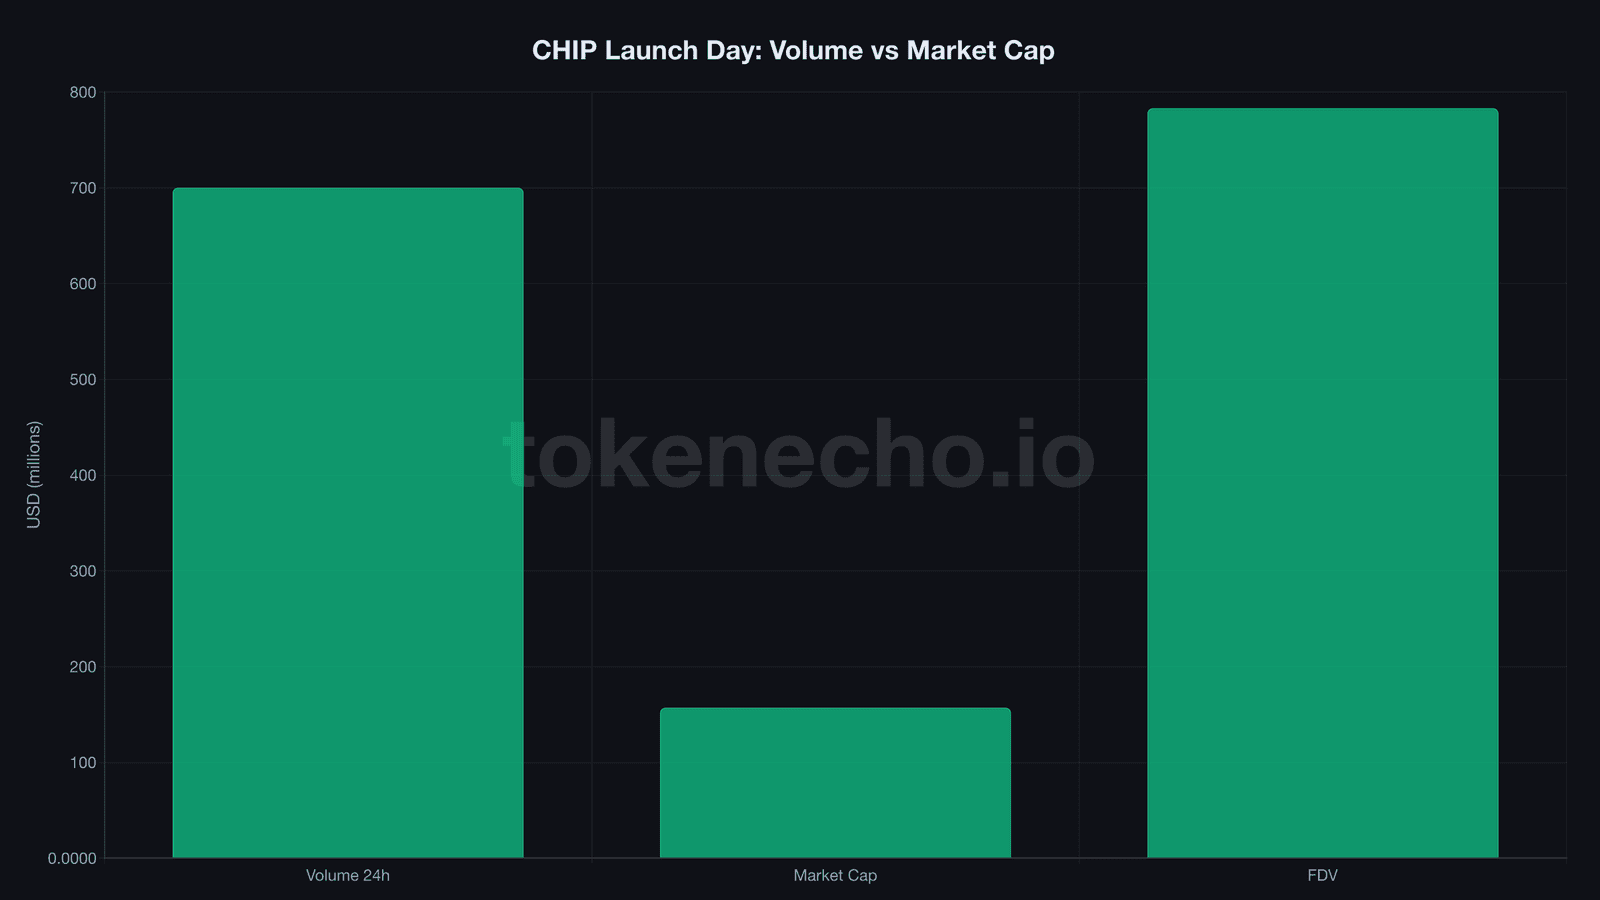
$700M chases a $157M token on day one
CHIP launched on April 21 with simultaneous listings on Upbit — South Korea’s largest exchange — and Binance pre-market perpetual futures at 5x leverage.
The CoinList public sale priced tokens at $0.03 back in February. By launch day, that price had more than doubled.
CHIP traded at $0.079 — a 2.6x return for ICO buyers. Decent.
But the volume profile tells a different story. $700 million flowed through CHIP markets in a single day — more than the combined daily volume of Cardano and Polkadot last week.
We’ve tracked this pattern across multiple low-cap launches this year. Enjin’s 180% rally from its all-time low produced a 3.3x volume-to-mcap ratio before cooling off.
Highstreet’s 247% pump was worse — a 21x ratio before the whole thing collapsed. Neither ended well.
The higher the ratio on a freshly listed token, the more that volume comes from derivatives and day traders rather than organic demand. And Binance offering perps on something that’s been trading for less than 48 hours only amplifies the dynamic.
Buying CHIP at this volume is a bit like bidding on a house after the realtor only let you see two rooms out of ten — you’re putting down money on 20% of the property while the other eight rooms stay locked behind a door that doesn’t open for at least 12 months.
GPU-backed lending separates CHIP from empty hype
This isn’t another memecoin DAO running on vibes and a Discord server.
USD.AI operates a permissionless lending protocol where GPU operators tokenize their hardware as collateral and borrow against it instantly. The pipeline is substantial — a $500 million credit facility with Sharon AI landed in January 2026.
QumulusAI put up another $500 million in late 2025.
Then came OBEX, which selected USD.AI for its inaugural $1 billion deployment cohort in March. And a batch of 576 NVIDIA B300 GPUs in Washington State backed a new facility as recently as April 6.
Over $7.7 billion in sUSDai, the protocol’s yield-bearing stablecoin, has traded to date. That’s not trivial — it puts USD.AI in the same transaction category as mid-tier DeFi stablecoins.
YZi Labs (formerly Binance Labs) invested in the project, and Messari published a formal valuation report in March.
So does a real product make the tokenomics any less dangerous?
Ask RAVE holders. RaveDAO had Warner Music partnerships and 100,000+ event attendees. None of that mattered when 90% of supply sat in three Gnosis Safe wallets controlled by insiders.
The 80% lockup problem RAVE holders know too well
The last time we saw this float-to-FDV ratio, RAVE was trading near $28. Twelve days later, it was worth $1.13.
CHIP’s numbers are worse on paper. Only 20% of supply circulates, compared to RAVE’s 24%.
The FDV-to-market-cap gap, the ratio between what every token would be worth at today’s price versus the actual circulating value, stretches to 5.0x. RAVE’s peaked at 4.2x before the collapse.
The critical difference sits in the vesting structure. CHIP’s investor and core contributor tokens lock behind a 12-month cliff — zero percent unlocks before month 12.
Then 33% drops at once, and the remaining 67% vests monthly over 24 months.
That cliff buys time.
RAVE had no such protection. Insiders moved 18.58 million RAVE to Bitget before the crash, and on-chain investigators confirmed the movements matched project-controlled wallets.
“Low-float, high-FDV token launches are predatory tokenomics by design,” said Zach Rynes, Chainlink’s community ambassador, during the RaveDAO fallout. “You’re buying a fraction of the real supply at a price that assumes the full supply is worth multiples more.”
Does that apply to CHIP? The fully diluted valuation sits at $783 million. The actual circulating value is $157 million.
If even a fraction of the locked 80% hits exchanges early — or if the 33% cliff unlock arrives with the project trading sideways — the math gets ugly fast.
And with $33 million raised across a CoinList public sale and a Series A, there are plenty of early investors who could sell the moment their tokens unlock.
What to watch over the next 72 hours
- Volume/mcap ratio drops below 2x — speculation cooling, organic price discovery starting. Still above 3x after 48 hours? The speculative frenzy isn’t going anywhere.
- Binance perps funding rate — deeply negative means shorts are paying and a squeeze could push prices higher. Deeply positive means overleveraged longs sitting on a trap door.
- Large wallet movements from non-public-sale addresses before the 12-month cliff. On-chain watchers flagged RAVE insider moves days before the crash. Same tools apply — different token, same red flags.
If you’re new to crypto, understanding how token supply and vesting schedules shape price is one of the most expensive lessons the market teaches — usually the hard way.
$700M in volume says the market wants CHIP. An 80% locked supply says the market hasn’t priced in the full picture yet. Whether this ends like RAVE or diverges comes down to one question: does the cliff hold?
This is not financial advice. DYOR. Data as of April 22, 2026.
Sources: CoinGecko, CryptoRank, USD.AI, ICO Drops
Leave a Reply