
🕑 6 min read
On-chain data shows the $74K relief rally triggered the third-largest old-coin sell-off of 2026 — while institutions rushed to absorb the supply
Bitcoin’s 46-day extreme fear streak — the longest since Terra-LUNA collapsed in 2022 — finally broke on April 14 when BTC surged past $74,000.
Celebrations were premature.
Within 24 hours, long-term holders dumped the biggest haul of old coins since the March crash. And they took a 20% loss doing it.
Key Takeaways
- CDD, a metric tracking dormant coin movement, spiked to 19.6 million on April 14 — the third-largest old-coin sell-off in 60 days — precisely as Bitcoin crossed $74K and fear sentiment reset
- LTH-SOPR crashed from 1.228 to 0.795 overnight — long-term holders swung from 22.8% profit to 20.5% loss in a single day, the most violent reversal since March 22
- Binance lost 18,606 BTC ($1.38 billion) in 13 days while Goldman Sachs filed its first Bitcoin ETF and weekly ETF inflows hit $1.1 billion — institutions are buying what veterans are dumping
Data Comparison Table
| Metric | Current (Apr 15) | 7d ago | 30d ago | Signal |
|---|---|---|---|---|
| CDD (coin-days) | 7.0M (spike: 19.6M Apr 14) | 6.4M | 8.3M | ⚠️ Caution |
| SOPR | 0.998 | 1.000 | ~0.985 | ⚠️ Caution |
| LTH-SOPR | 0.795 | ~0.870 | ~1.90 | ❌ Bearish |
| MVRV | 1.381 | 1.326 | ~1.22 | ▲ Bullish |
| NUPL | 0.276 | 0.246 | ~0.188 | ▲ Bullish |
| Puell Multiple | 0.662 | 0.730 | ~0.625 | ⚠️ Caution |
| Binance BTC reserves | 625,402 | 638,277 | ~639K | ▲ Bullish |
19.6 million coin-days destroyed — and almost none of it was forced
19.6 million. That’s how many coin-days got destroyed on April 14 — the very day Bitcoin punched through $74,000.
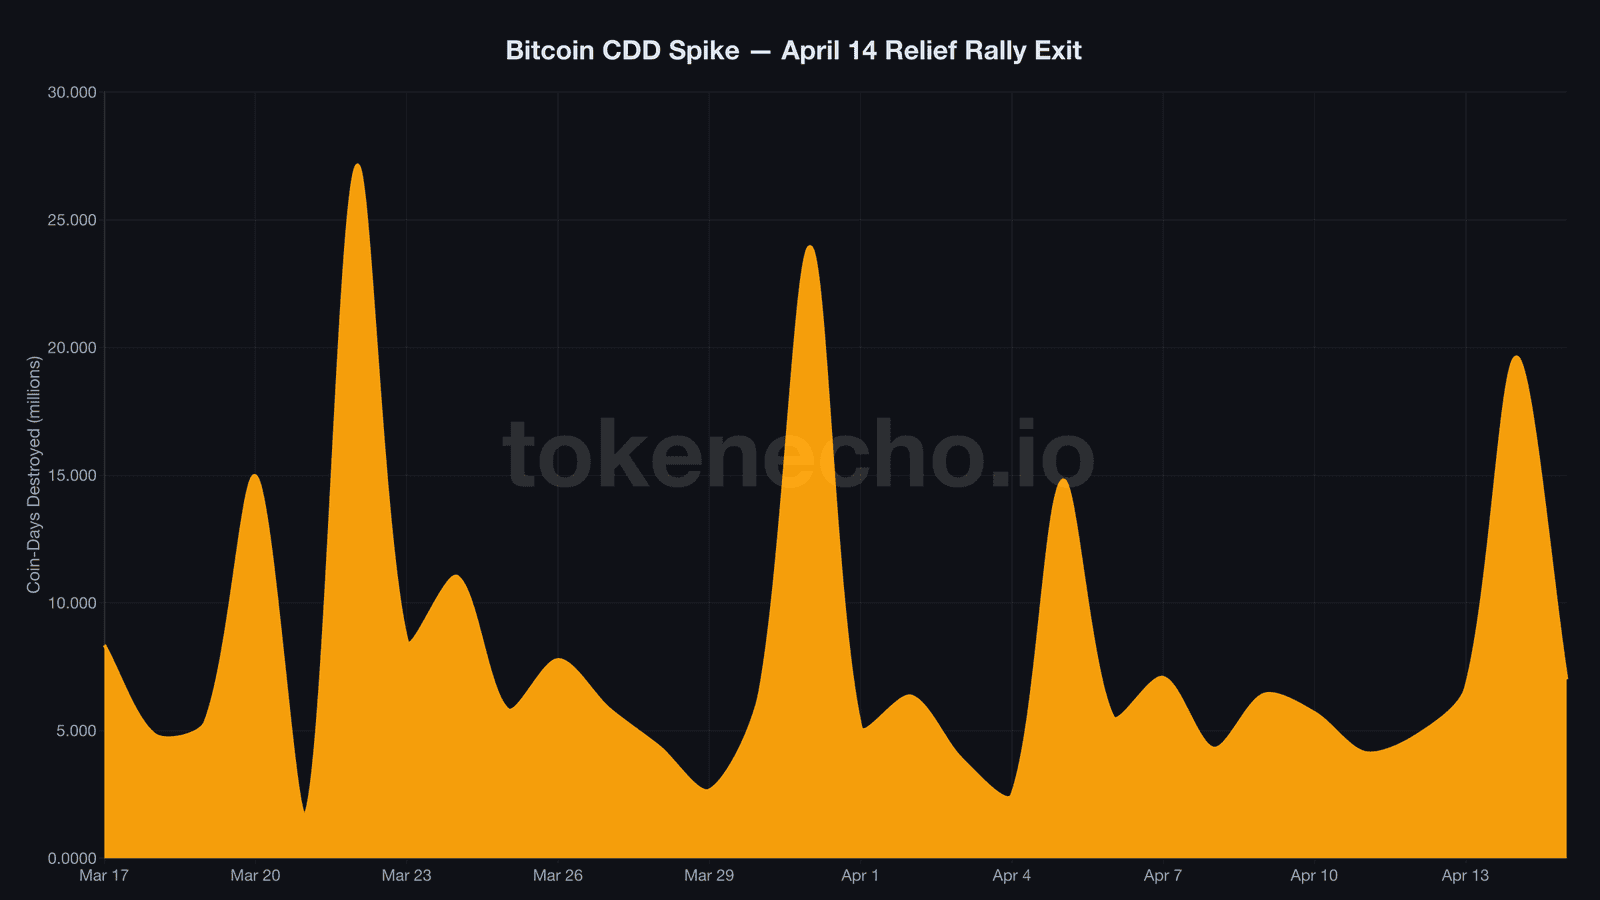
CDD, a metric measuring how many long-dormant coins suddenly come alive, doesn’t spike like this by accident. Only two days in the past 60 topped it: the March 22 capitulation crash at 27.1 million and the Q1 close on March 31 at 23.9 million.
Both were panic events. This one wasn’t.
Nobody forced these sellers. BTC was rallying, the 46-day extreme fear streak had just snapped, and the macro backdrop — Iran ceasefire, Morgan Stanley ETF launch — looked constructive for the first time in weeks.
And yet, some of Bitcoin’s most patient holders — the ones who white-knuckled through 46 straight days of extreme fear without selling a single sat — chose this exact moment to dump coins they’d sat on for months.
It’s the financial equivalent of surviving a house fire, then selling the house at a discount the day the flames go out. LTH-SOPR explains why.
Long-term holders flipped from 22% profit to 20% loss overnight
The last time LTH-SOPR, a ratio showing whether long-term holders sell at a profit or loss, whipsawed this violently was March 22. That crash took five days to drive it from 1.94 down to 0.76.
This time? Twenty-four hours. During a rally.
On April 14, LTH-SOPR read 1.228 — the average long-term seller locked in a 22.8% gain. By the next morning, it had cratered to 0.795.
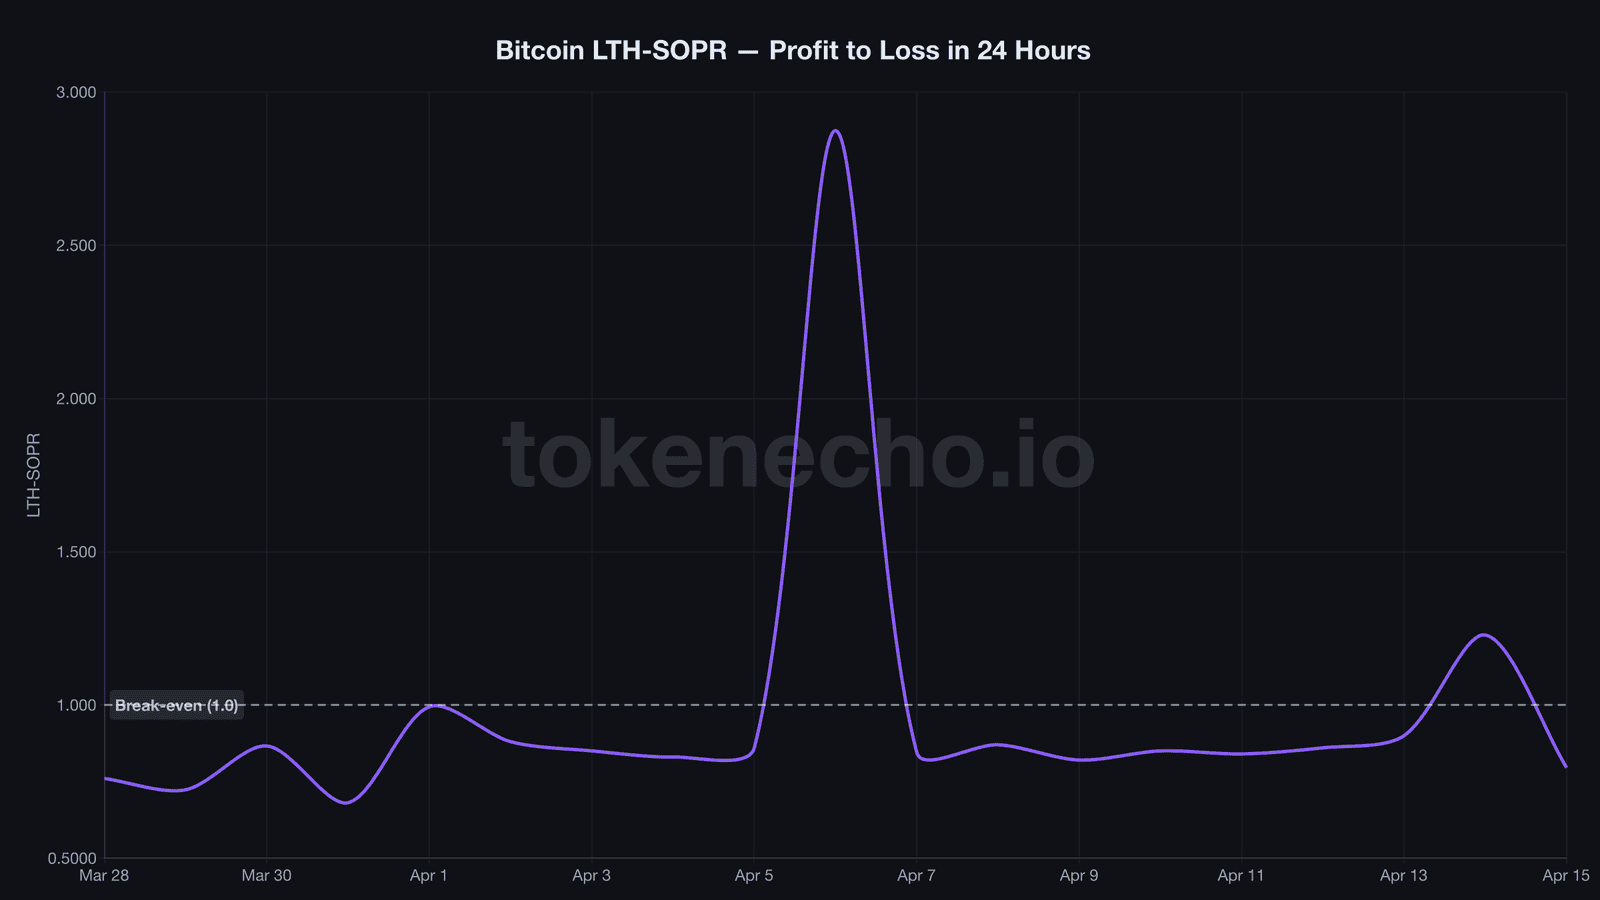
That’s a 20.5% loss. The profit window slammed shut faster than at any point since the March crash.
SOPR, the broader ratio covering all Bitcoin transactions, slipped back to 0.998 — just below the critical 1.0 break-even line that sellers have battled since late March. Bitcoin briefly crossed above it on April 6, held for barely two days, then lost it again.
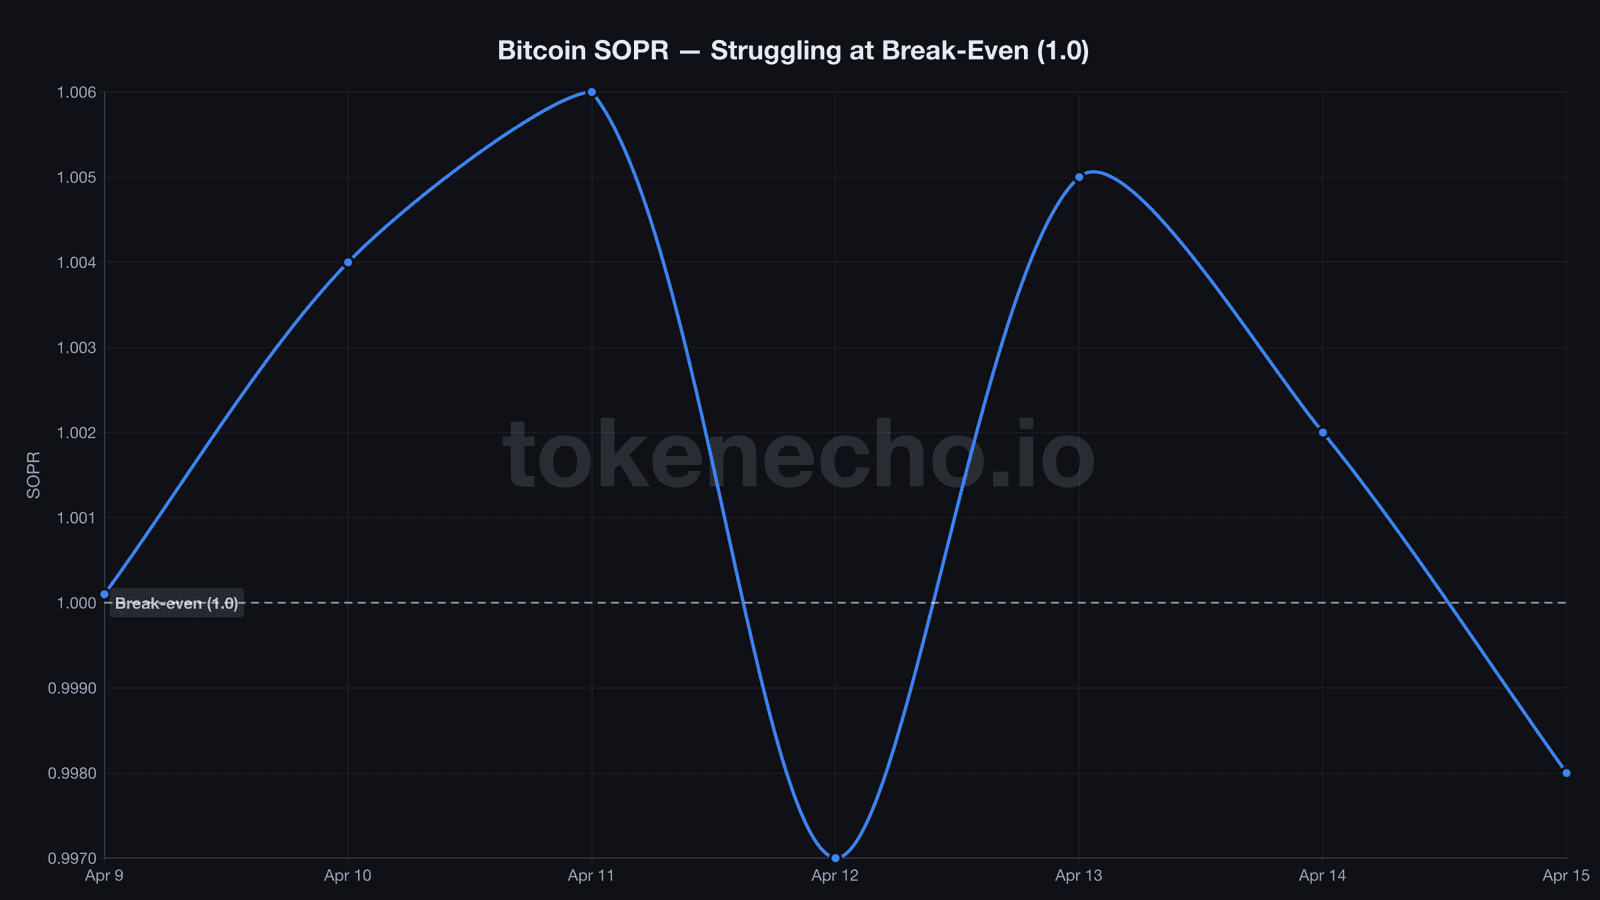
Can sellers actually get back to break-even? The pattern isn’t encouraging.
MVRV, the ratio of market value to realized value, sits at 1.381. Not overheated — the average holder still carries a 38% unrealized gain. But NUPL, which measures net unrealized profit across the entire network, reads just 0.276.
We’ve tracked NUPL through three capitulation events now. This level sits right on the knife-edge between “fear” and “optimism.” A slip below 0.25 would signal the recovery is stalling.
“Old whales are selling Bitcoin to new whales — TradFi — not retail investors,” Ki Young Ju, CEO of CryptoQuant, said. “This can be clearly observed on-chain.”
The April 14-15 record is textbook proof: generational ownership transfer at prices well below what those old whales originally paid.
Binance lost $1.38B in BTC while Goldman filed to buy more
Long-term holders are heading for the exits. Institutions are sprinting the other direction.
Binance has hemorrhaged 18,606 BTC in just 13 days — $1.38 billion at current prices. Reserves hit 620,499 on April 16, and the pace is accelerating. The last four days alone account for 74% of the entire 13-day outflow.
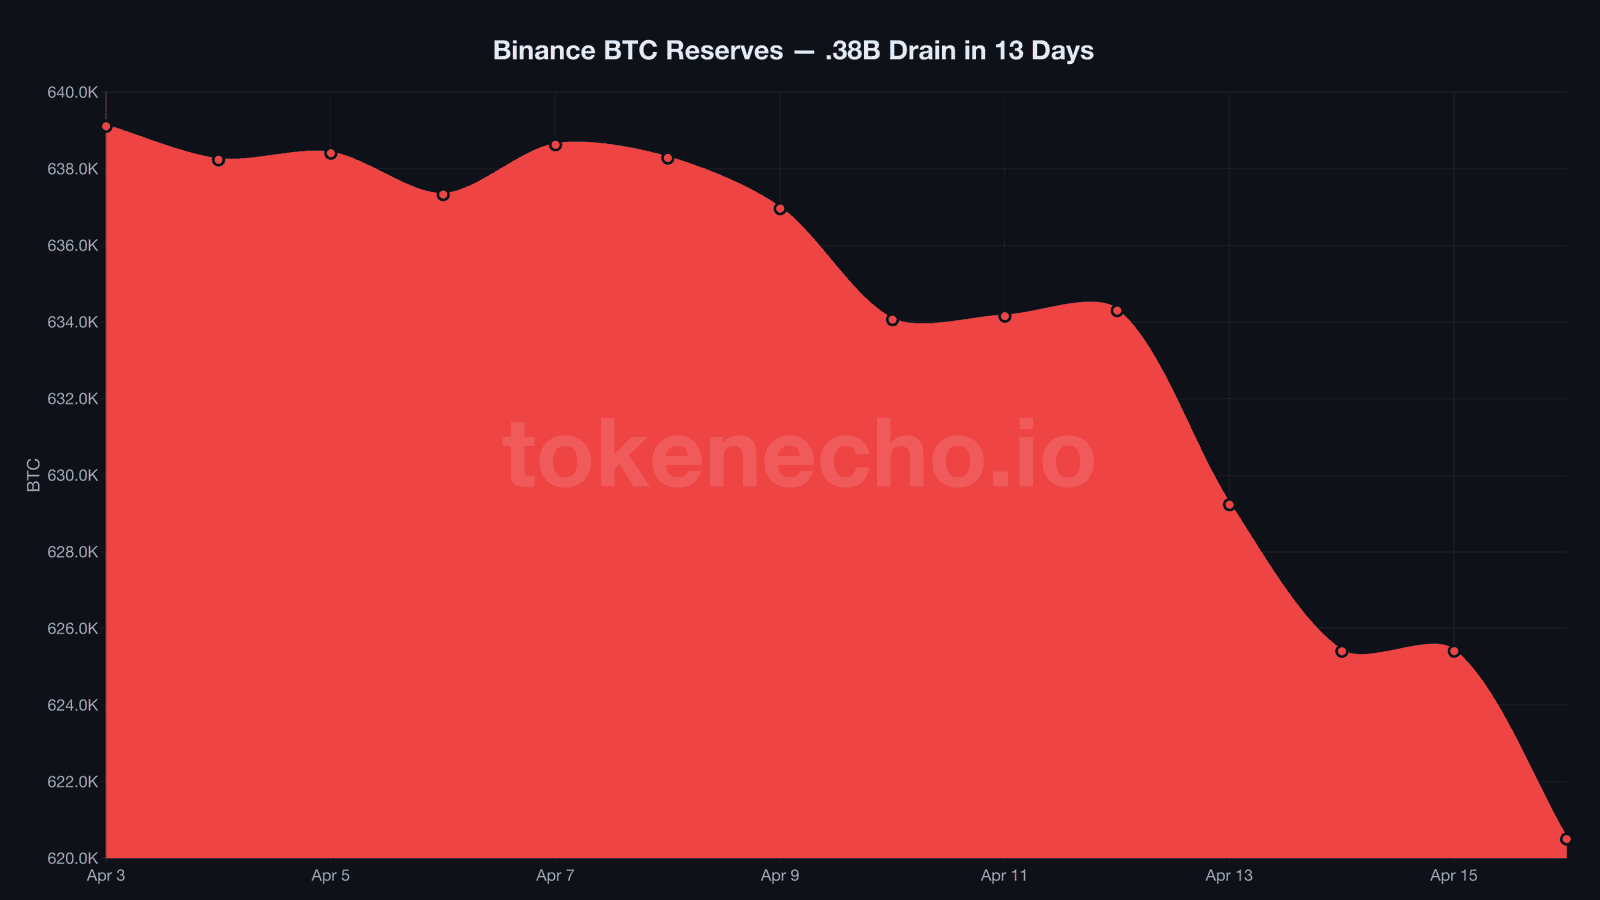
On April 16, someone pulled 4,903 BTC off Binance in a single day. That’s $365 million — the largest daily outflow this month.
So who’s absorbing all this supply? The list keeps growing. Goldman Sachs filed its first-ever Bitcoin ETF on April 15. Morgan Stanley’s MSBT launched on April 8 with the industry’s cheapest fee at 0.14%. Strategy scooped up another 13,927 BTC ($1 billion) on April 13.
And spot Bitcoin ETFs pulled in $1.1 billion weekly — the strongest inflow pace since January.
Benjamin Cowen, a prominent crypto analyst, called this a “late-cycle distribution phase” where recoveries mask structural selling. But distribution into this kind of institutional demand isn’t capitulation. That’s a changing of the guard.
Old coins moved this fast once before — BTC was at $16K
The closest parallel isn’t the March 2026 crash. It’s the FTX aftermath of late 2022.
In December 2022, Bitcoin traded near $16,500 and CDD spiked repeatedly as battle-scarred holders redistributed into what felt like a hopeless market. NUPL hovered near 0.20 — today it reads 0.276. LTH-SOPR oscillated between 0.70 and 0.85 — today it’s 0.795.
The metrics rhyme.
What followed? BTC rallied 56% to $25,000 within 60 days. Within 90 days it hit $31,000 — a 94% gain from the lows.
One major caveat: in late 2022, MVRV bottomed at 0.80 and the entire market was underwater. Today’s 1.38 means 38% unrealized profit still exists system-wide, and institutional infrastructure like spot ETFs, bank-issued funds, and corporate treasury programs didn’t exist yet. The current setup rhymes with post-FTX — but the demand side has no historical precedent.
On-chain scorecard (3 of 6 bullish):
- ✅ MVRV 1.38 — above realized value, room to run before overheated zone
- ✅ NUPL 0.276 — recovering from capitulation, entering optimism territory
- ✅ Binance reserves declining — 18,606 BTC supply squeeze in 13 days
- ⚠️ SOPR 0.998 — break-even line rejected again, sellers still bleeding
- ⚠️ Puell 0.662 — miner revenue 34% below yearly average
- ❌ LTH-SOPR 0.795 — long-term holders selling at 20% loss
TokenEcho Verdict: Cautiously bullish
Key level: $74K must hold as support. A sustained close above it — with exchange reserves continuing to fall — validates the institutional absorption thesis.
Risk: If ETF inflows drop below $200 million weekly while LTH-SOPR stays under 0.85, sell pressure could drag BTC back toward $68-70K.
This is an analytical assessment, not financial advice.
Three triggers that decide whether this was a cleansing or a warning
- SOPR reclaiming 1.0 with conviction — not a single-day touch like April 6. A sustained break above 1.0 confirms sellers have stopped bleeding.
- Binance outflows above 5,000 BTC per day for three consecutive days — April 16’s drain (4,903 BTC) came close. Three straight days at that pace signals a structural shift, not whale rebalancing.
- CDD dropping below 5 million while price holds above $74K — low CDD + stable price means the old-coin supply has been fully absorbed. If CDD stays above 10 million, more distribution is still coming.
This analysis is part of our daily Bitcoin price tracking. See all previous analyses and key metrics on our hub page.
Long-term holders voted with their wallets. Institutions answered with theirs. Which side runs out of conviction first will shape the rest of Q2.
This is not financial advice. DYOR. Data as of April 16, 2026.
Sources: CryptoQuant (SOPR, LTH-SOPR, MVRV, NUPL, CDD, Puell Multiple, Binance reserves), CoinGecko (BTC price, market cap, ATH data), Ki Young Ju via X
Leave a Reply