🕑 7 min read
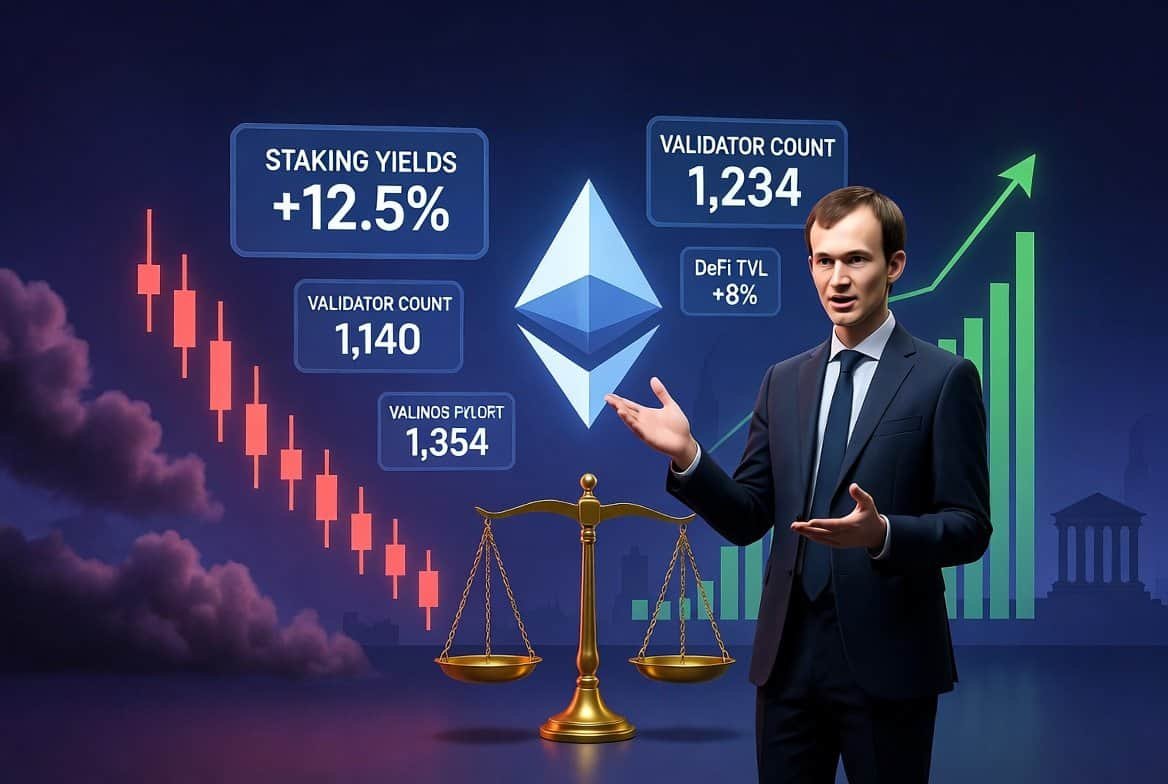
Thirty percent of all Ethereum in existence is locked up and earning yield right now. Not trading. Not sitting on exchanges waiting to be dumped. Locked. Staked. Working.
That’s 36 million ETH – and it’s a number that should make you reconsider everything you think you know about where ETH is headed. Because while crypto Twitter debates whether Ethereum is “dead” (it isn’t) or whether Solana “won” (it hasn’t), the on-chain data paints a picture so disconnected from the price that something eventually has to give.
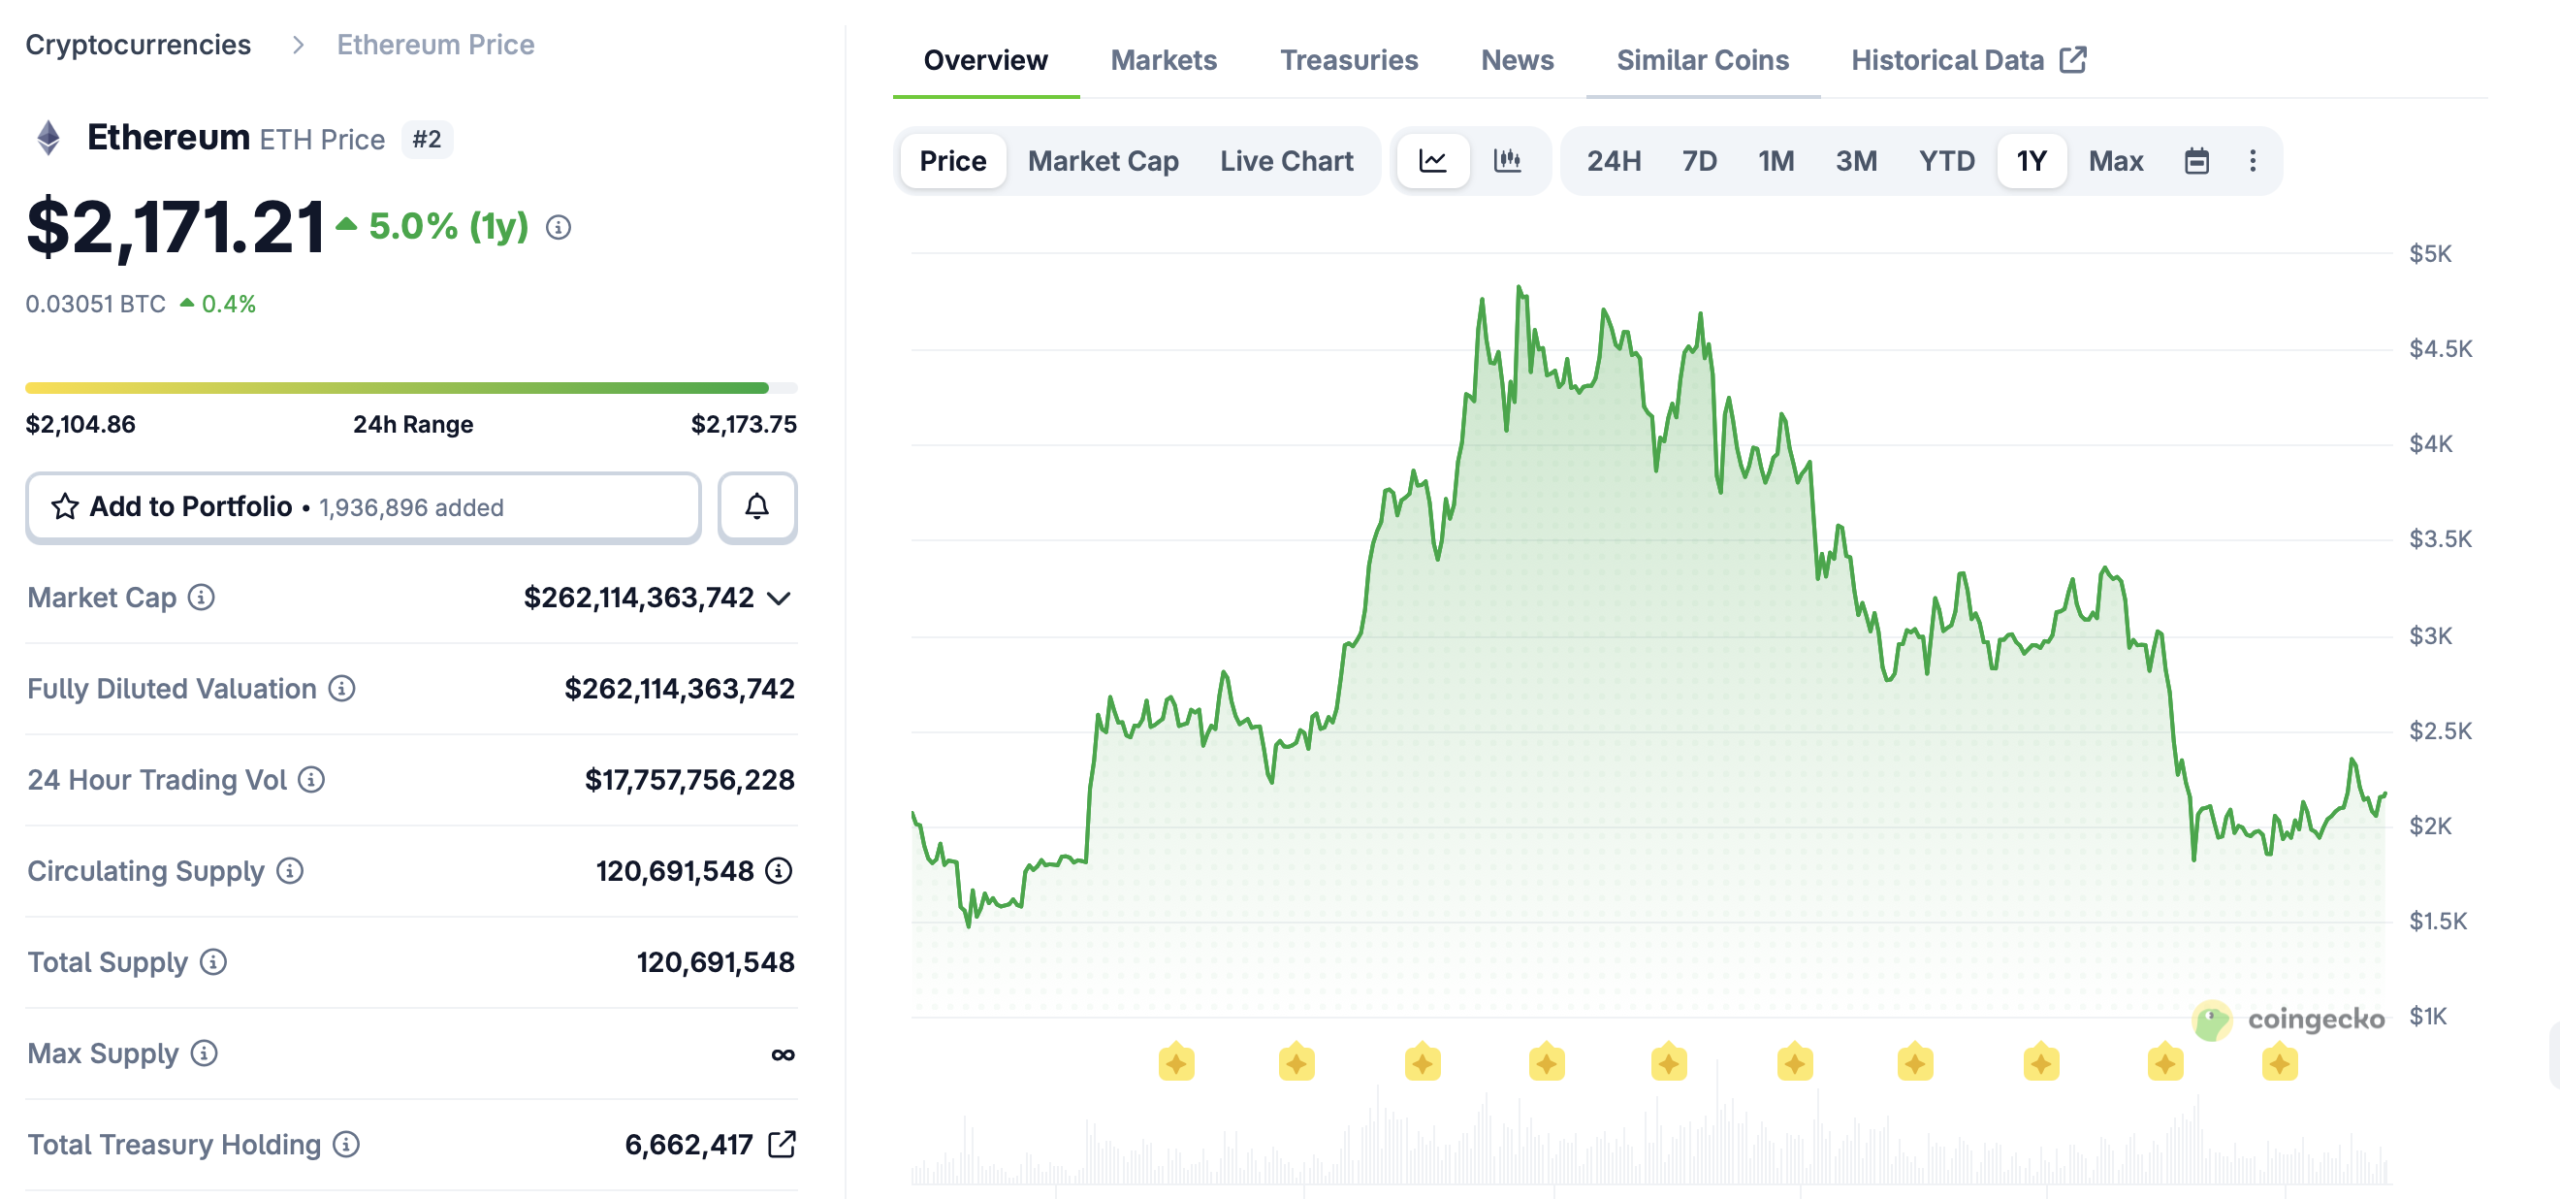
ETH is trading at $2,171. The all-time high was $4,946 back in August 2025. That’s a 56% haircut. Painful? Absolutely. But we’ve been digging through the fundamentals, and what we found doesn’t match a coin that’s supposed to be dying.
The Disconnect That Keeps Us Up at Night
DeFi deposits on Ethereum just hit 25.3 million ETH. All-time high. Not in dollar terms – in actual ETH. To put that in perspective, more ETH is sitting inside smart contracts right now than at any point during the 2021 bull run, the NFT mania, or the DeFi summer craze.
And during February’s 21% crash? Users didn’t pull their ETH out. They deposited 2.7 million more. That’s roughly $5.3 billion walking INTO DeFi protocols while the price was collapsing. We haven’t seen behavior like that… honestly, ever. In 2022 when Terra blew up, TVL went from $142 billion to $10 billion. Capital sprinted for the exits. This time it’s doing the opposite.
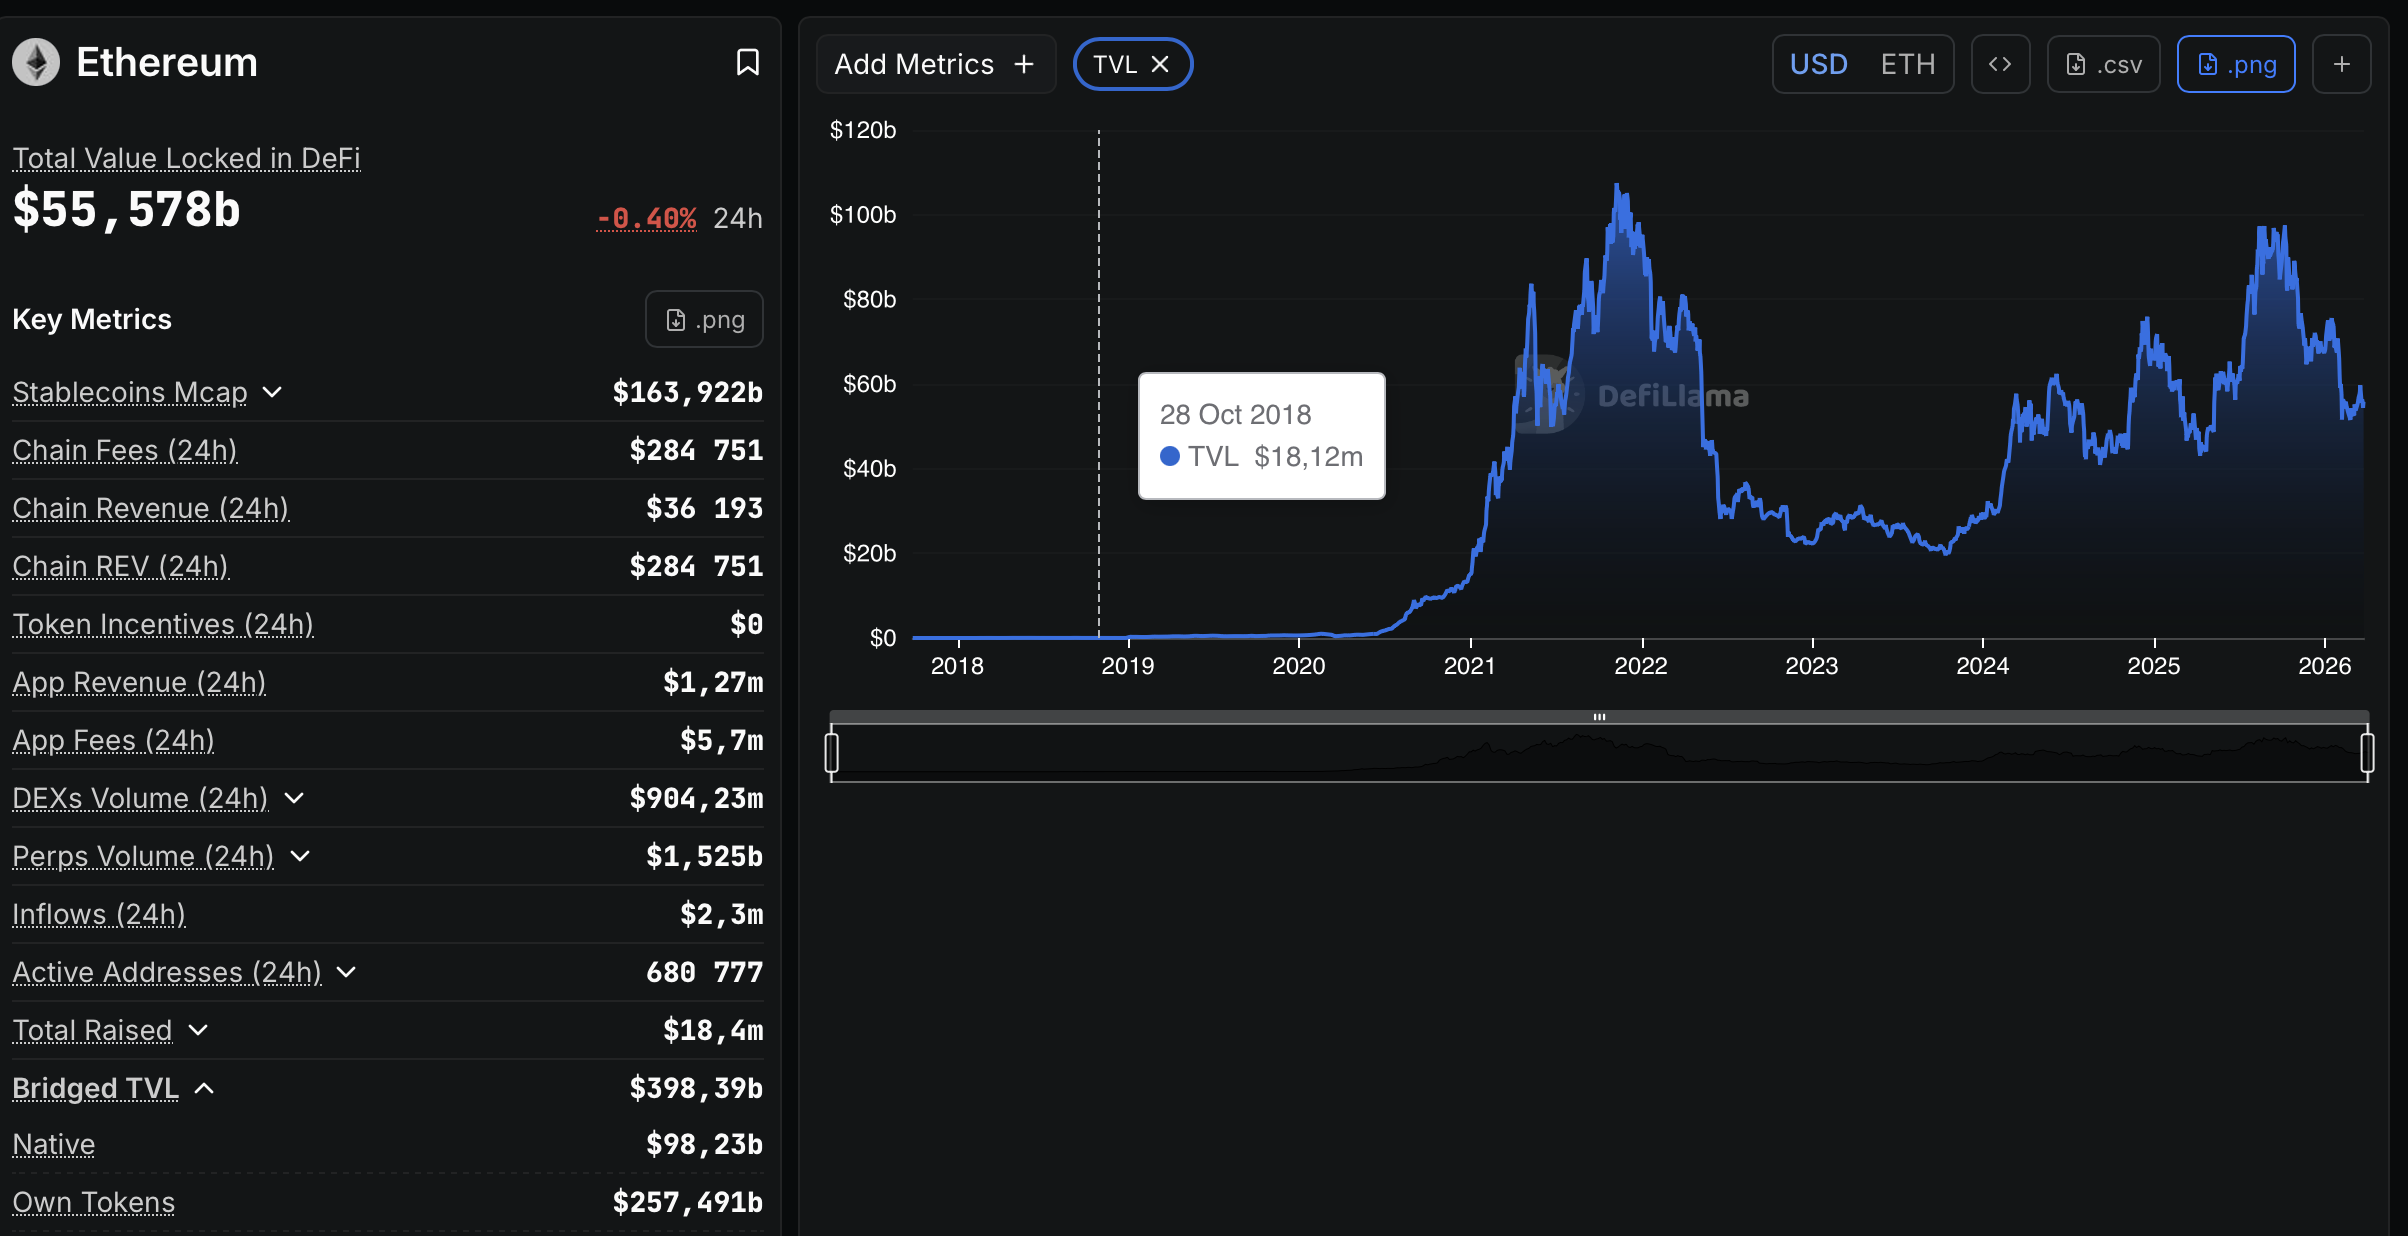
On-chain liquidation exposure dropped 84% year-over-year to just $53 million. The ecosystem learned from its scars. Lower leverage, healthier collateral, fewer cascading blowups. It’s not the same DeFi that nearly destroyed itself three years ago.
So you’ve got record deposits, rock-bottom liquidation risk, and a price that’s been cut in half. Either the market is seeing something the data isn’t showing – or it hasn’t caught up yet.
What Changed on March 17 (And Why It Matters More Than the Price)
Two things happened in the span of five days that could reshape ETH’s trajectory for years.
On March 12, BlackRock launched the iShares Staked Ethereum Trust – ticker ETHB. This isn’t just another crypto ETF. It’s the first regulated product that lets pension funds, endowments, and family offices earn staking yield on ETH. About 3.3% annually, through a wrapper their compliance teams can actually approve. Think of it as the moment ETH stopped being a “speculative crypto asset” and became something closer to a dividend-paying stock in institutional portfolio models.
Then on March 17, the SEC and CFTC dropped a 68-page bombshell: Ethereum is officially a digital commodity. Not a security. This isn’t soft guidance – it’s a binding joint ruling carrying the full weight of federal law. Survey data shows 43% of family offices plan to allocate to digital assets within 12 months now that the legal fog has cleared. That’s a wave of capital that hasn’t shown up in the price yet.
Where We Think ETH Goes From Here
We’re going to skip the standard crystal ball format because, frankly, anyone who gives you a single number for a 2030 price prediction is either lying or selling something. What we can do is lay out the scenarios as we see them and tell you which one our data leans toward.
The staking flywheel scenario. If institutional adoption of staking ETFs accelerates through 2026-2027 – and the SEC ruling suggests it will – you get a compounding effect. More ETH staked means less ETH on exchanges. Less ETH on exchanges means tighter supply. Tighter supply during rising demand means… you know where this goes. Under this scenario, ETH reclaims $4,000-$6,000 by late 2026, pushes toward $7,500 in 2027 as the flywheel spins faster, and potentially touches $10,000-$13,000 around the 2028 Bitcoin halving when the entire market tends to rip. By 2030, we’re looking at $15,000-$25,000 if Ethereum solidifies its role as the institutional settlement layer.
The macro headwind scenario. The Fed isn’t cutting rates anytime soon. Inflation forecast just got bumped to 2.7%. Treasuries at 3.5% are a very real competitor to ETH’s 3.3% staking yield – except Treasuries don’t drop 56% when Trump tweets about Iran. If macro stays hostile through 2026, ETH probably grinds sideways between $2,000 and $3,800. The institutional pipeline converts slowly. Maybe $4,500-$7,500 by 2027. The 2028 halving provides a tailwind but not a miracle – call it $5,500-$10,000. And by 2030, somewhere around $6,000-$15,000 depending on whether the “digital bond” narrative sticks with allocators.
The fragmentation risk. This is the bear case nobody in the ETH community wants to discuss. Solana gained 6.6% over the past month on similar fundamentals. Base – built by Coinbase on top of Ethereum – is siphoning activity off mainnet. Arbitrum and Optimism are doing the same. The “fat protocol thesis” assumed value would accrue to the base layer. What if it doesn’t? What if L2s eat the fees and ETH becomes the security layer nobody pays premium for? Under fragmentation, ETH stays rangebound: $1,500-$2,000 through a rough 2026, $2,500-$4,000 by 2027, and a slow grind to $3,500-$6,000 by 2030. Not dead. Just… underpaying for what the network actually does.
Our editorial lean: somewhere between the staking flywheel and the macro headwind. The SEC ruling and BlackRock’s ETF are structural changes, not cycle trades. But the Fed and Iran aren’t going away tomorrow. We think $2,500-$3,800 for the rest of 2026 is the most honest range, with the upside unlocking if rate cuts materialize in H2.
The Levels That Matter Right Now
If you’re watching the chart, these are the numbers our team tracks:
$1,800 is the floor you don’t want to see break – it’s the 200-day moving average zone where heavy accumulation has clustered. Below that, you’re looking at $1,400-$1,500, levels from early 2024 that would signal a genuine bear market.
$2,500 is the near-term hurdle. ETH needs to clear this with volume and ETF inflow confirmation to signal the bottom is in. We’ve bounced off it twice and failed.
$3,400 is the big one – that’s where ETH opened 2026. Reclaiming it means the year-to-date drawdown is erased and momentum shifts. Above that, $4,946 (the ATH) becomes the target.
What About Those Big Round Numbers Everyone Asks About
Can ETH hit $5,000 in 2026? It came within $54 of that level last August, so the price isn’t uncharted. But getting there again requires two things the market doesn’t have right now: Fed rate cuts and sustained ETF inflows. With Iran still simmering and inflation above target, both remain uncertain. Possible, not probable.
Is a 56% drawdown a buying opportunity or a warning? The Buffett crowd would point out that when fundamentals improve while price declines, you’re looking at a margin of safety – not a failing asset. Record DeFi deposits, commodity classification, staking ETFs, and deflationary supply aren’t bearish data points. But “the market can stay irrational longer than you can stay solvent” remains the most honest disclaimer in finance.
How does the ETH ETF differ from Bitcoin’s? This matters more than people realize. Bitcoin ETFs give you pure price exposure – that’s it. BlackRock’s ETHB earns staking yield, roughly 3.3% annually, on top of price moves. In portfolio construction terms, that makes ETH behave more like a dividend stock than a commodity. For institutional allocators comparing yield-bearing assets, that’s a fundamentally different conversation than “should we buy Bitcoin.”
Reference: Price Ranges by Year
| Year | Conservative | Mid-Range | Aggressive |
|---|---|---|---|
| 2026 | $1,500-$2,000 | $2,500-$3,800 | $4,000-$6,000 |
| 2027 | $2,500-$4,000 | $4,500-$7,500 | $7,500-$10,000 |
| 2028 | $3,000-$5,000 | $5,500-$10,000 | $10,000-$13,000 |
| 2029 | $4,000-$6,000 | $7,000-$12,000 | $12,000-$18,000 |
| 2030 | $3,500-$6,000 | $6,000-$15,000 | $15,000-$25,000 |
Risks That Could Break the Thesis
We’d be dishonest if we didn’t flag what keeps us cautious. Aave controls 27% of Ethereum’s DeFi TVL – one protocol, one quarter of the ecosystem. A smart contract exploit at that scale would make the Resolv hack look like pocket change. Staking yield at 3.3% and falling means the incentive to lock ETH is shrinking; the validator queue is already near zero. And the regulatory clarity that’s currently a tailwind could become a headwind under a future administration that reinterprets the ruling. Political risk doesn’t expire.
This is not financial advice. DYOR. Price predictions are based on historical data, on-chain metrics, and analyst forecasts. Actual results may vary significantly. Data as of March 24, 2026.
Sources
- CoinGecko – ETH price, market cap, supply data
- CryptoQuant – Exchange flows, staking metrics
- SEC.gov – Joint SEC-CFTC commodity classification ruling
- CoinCodex – Analyst price forecasts
- CoinGlass – ETH ETF flow data
- DefiLlama – Ethereum DeFi TVL
- DataWallet – Ethereum staking statistics
Leave a Reply