
🕑 6 min read
Everyone keeps calling this a Bitcoin rally. The ETF data says someone disagrees.
On April 13, Bitcoin spot ETFs hemorrhaged $325.8M in a single session – Fidelity’s FBTC alone shed $229M. Meanwhile, Ethereum had just closed its strongest ETF week of 2026: +$187M in net inflows over April 6-10, with modest daily inflows continuing through the weekend.
And the price followed. ETH gained 10.58% over seven days, edging past BTC’s 9.18% for the first time in weeks.
At $2,321, Ethereum still sits 53% below its August 2025 all-time high of $4,946. But something underneath is shifting.
Key takeaways
- BTC ETFs lost $325.8M on April 13 while ETH ETFs posted +$187M for the week – the strongest inflow since January and a clear rotation signal.
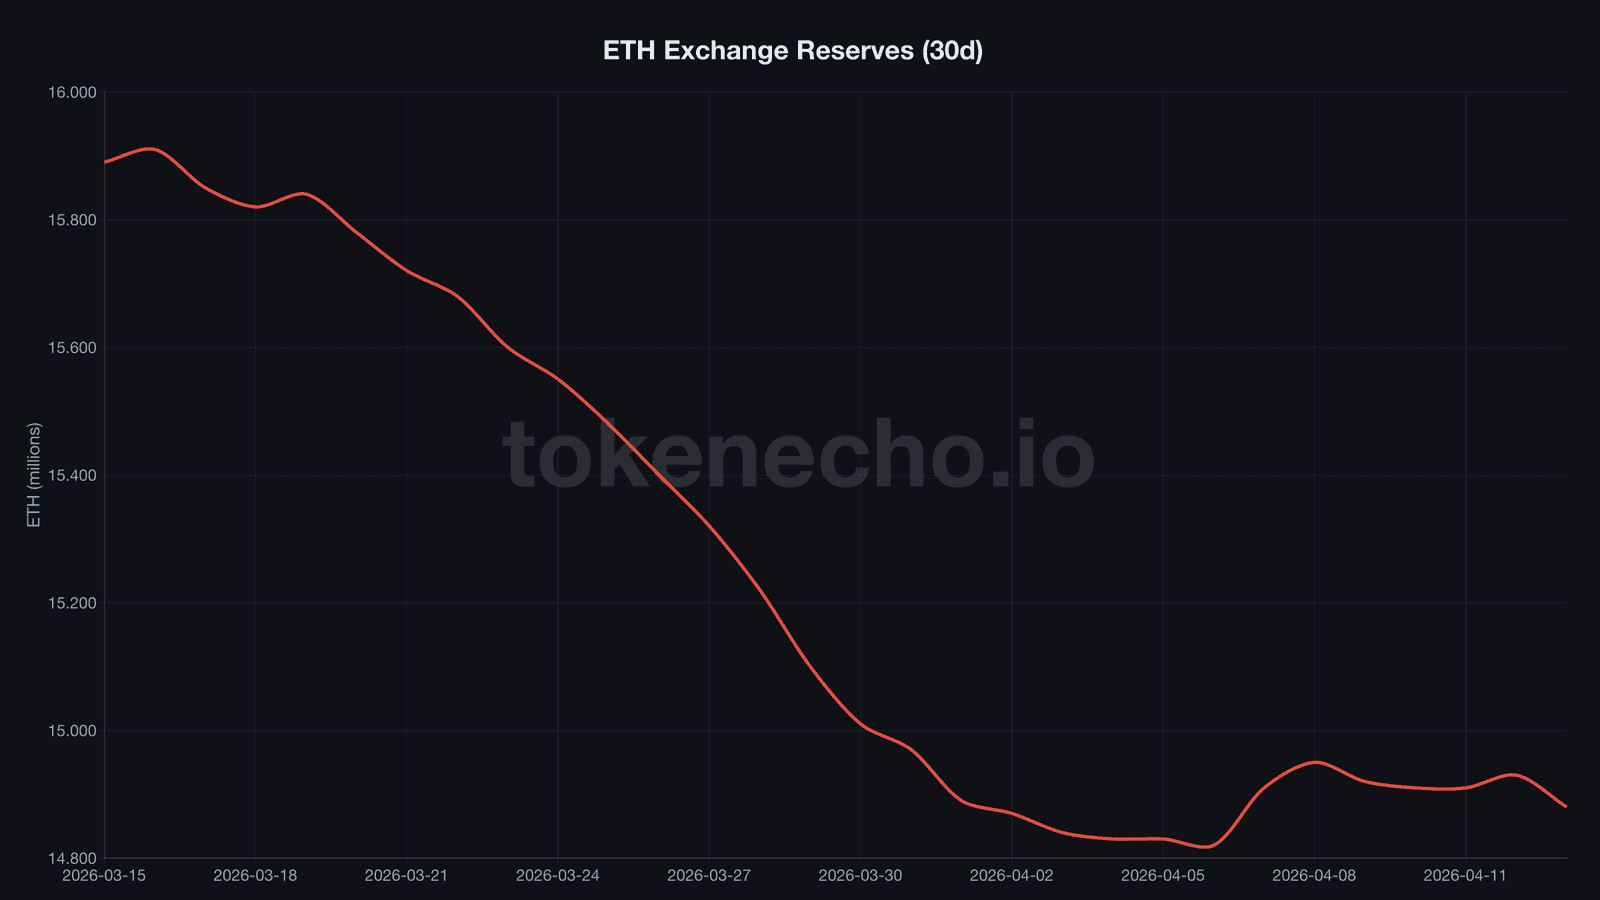
- 1.01 million ETH ($2.35B) left exchanges in 30 days. Reserves dropped to 14.88M, down 6.4% from 15.89M a month ago. The supply squeeze isn’t slowing.
- ETH outperformed BTC for the first time in weeks (+10.58% vs +9.18% 7d), and the ETH/BTC ratio crawled off its five-year floor to 0.0312.
Data snapshot
| Metric | Today | 7d ago | 30d ago | Signal |
|---|---|---|---|---|
| ETH price | $2,321 | $2,100 | $2,110 | ▲ Bullish |
| ETH/BTC ratio | 0.0312 | 0.0306 | 0.0305 | ▲ Bullish |
| Exchange reserves | 14.88M | 14.91M | 15.89M | ▲ Bullish |
| Leverage ratio | 0.954 | 0.937 | 0.877 | ⚠️ Caution |
| ETH ETF flows (wk) | +$187M | negative | negative | ▲ Bullish |
| Network activity | +41% w/w | baseline | – | ▲ Bullish |
| ETH dominance | 10.8% | ~10% | ~10% | – Neutral |
ETF flows split – and ETH takes the winning side
The divergence is hard to ignore.
BTC ETFs bled $325.8M on April 13, with Fidelity’s FBTC accounting for $229M of the damage. But ETH ETFs told the opposite story: +$187M in net weekly inflows, with BlackRock’s ETHA and Fidelity’s FETH capturing 84% of those flows.
“2026 will be the year of Ethereum,” said Geoff Kendrick, Head of Digital Assets Research at Standard Chartered. He’s been saying that since February. The April ETF data finally gives him something to point at.
ETH’s 10.58% weekly gain marks the first time Ethereum has outpaced Bitcoin on a weekly basis in weeks. The ETH/BTC ratio, stuck at a five-year floor of 0.0305 for most of March, nudged up to 0.0312.
That’s not a breakout. But it’s the first pulse in a flat line.
It’s a bit like watching money rotate out of Treasury bonds into equities during a rate-cutting cycle – the safe trade gets crowded, institutions start hunting for higher beta, and the assets that lagged worst during the drawdown suddenly look like the best risk-reward plays on the board. In crypto, that “elsewhere” is ETH.
A million ETH left exchanges – and nobody blinked
46,689 ETH.
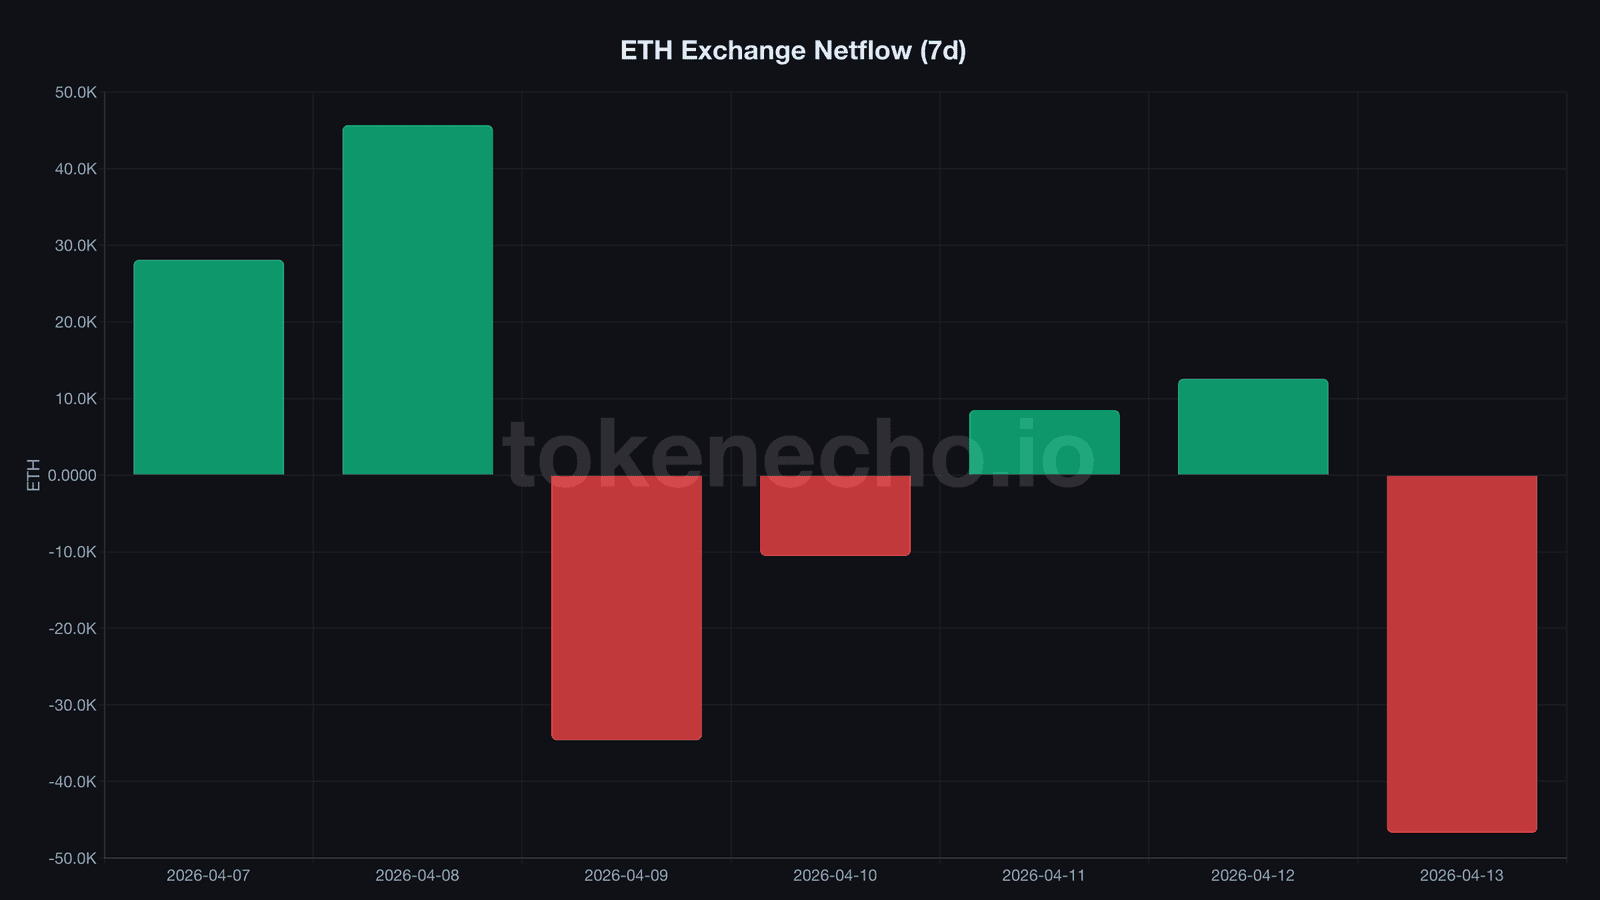
That’s what someone pulled off exchanges on April 13 alone – roughly $110M worth. And it wasn’t an anomaly.
Over the past 30 days, 1.01 million ETH has drained from exchange wallets – roughly 6.4% of all exchange-held supply. At current prices, that’s $2.35 billion worth of ETH that moved into cold storage, DeFi protocols, and staking contracts. Total reserves now sit at 14.88M, down from 15.89M a month ago.
The outflows didn’t come in a straight line. Between April 6 and 8, exchanges actually saw 141,000 ETH flow IN as traders sold into the Iran ceasefire rally.
But by April 9, the tide reversed. April 13’s outflow was the largest single-day withdrawal in a week.
Whoever was selling during the bounce is done.
On-chain activity backs this up. Ethereum network usage jumped 41% week-over-week – the steepest climb in months. So who’s putting that ETH to work if it’s not sitting on exchanges?
DeFi protocols hold a record 25.3 million ETH – more than at any point in the network’s history.
BitMine, now listed on the NYSE, controls 4.875 million ETH – that’s 3.98% of all circulating supply. The company just expanded its buyback program to $4 billion.
And Charles Schwab opened an ETH trading waitlist for its 38.9 million clients managing $11.9 trillion in assets. Is this a real rotation – or just noise from a single week of data?
Leverage rebuilds while Glamsterdam devnet goes live
The last time Bitcoin broke out of a 40-plus day extreme fear streak – November 2022, after FTX collapsed – ETH sat at $1,200. Within 90 days, it rallied 42% to $1,700. Over six months, it nearly doubled.
Today’s setup rhymes.
The Fear & Greed Index, a sentiment gauge where anything below 25 signals extreme fear, jumped from 8 to 53 on April 13 – snapping a 46-day streak that was the longest since that 2022 episode.
ETH trades at $2,321. The estimated leverage ratio, a measure of derivatives open interest relative to exchange reserves, sits at 0.954 – up from 0.908 just five days ago.
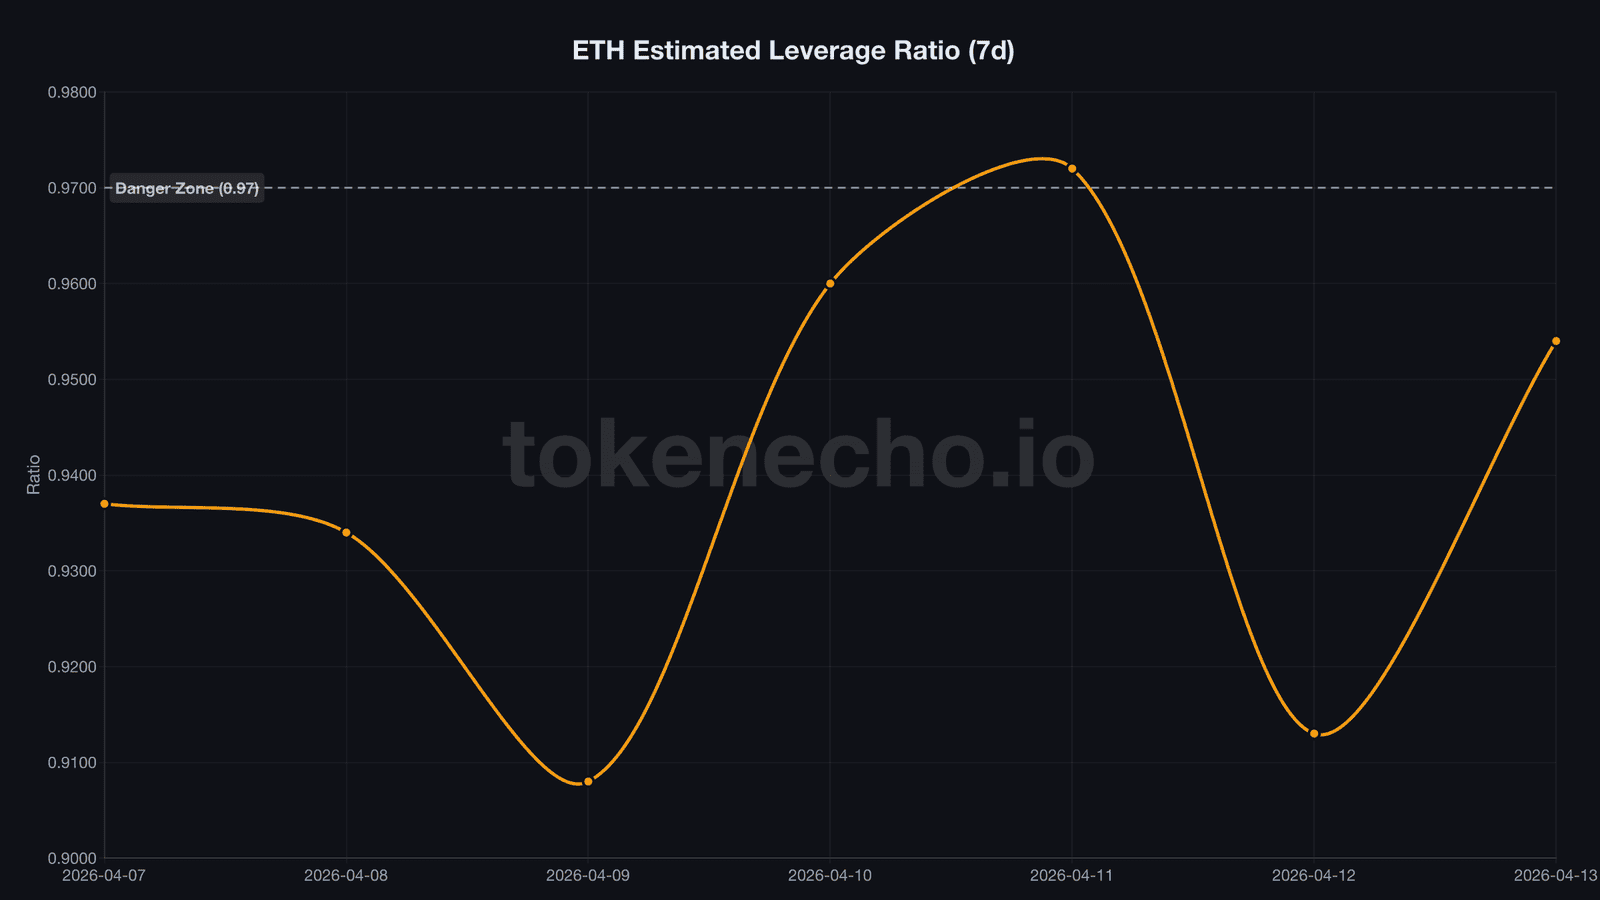
That rising leverage is a double-edged sword. Traders are placing bets on continued upside. But the last spike to 0.972 on April 1 preceded a 5% pullback within 48 hours. Leverage without a spot catalyst is a loaded spring.
This time, there’s a catalyst. The first Glamsterdam devnet launched this week – a milestone for Ethereum’s biggest upgrade since The Merge, targeting 10,000 TPS and 78% lower gas fees. That’s not priced in yet.
The last time fear broke like this, ETH rallied 42%
The historical parallel matters because the conditions rhyme but the infrastructure doesn’t.
In November 2022, ETH traded at $1,200 after FTX imploded – exchange reserves were in freefall just like today, sentiment was pinned in extreme fear for weeks, and there were no spot ETH ETFs, no major brokerage waitlists, and no publicly traded company hoarding nearly 4% of the entire circulating supply on the NYSE.
It does now.
The 2022 fear reset produced a 42% ETH rally in 90 days. The current reset starts with ETH at $2,321, thinner exchange supply, and institutions actively building exposure. The asymmetry tilts further now – if the rotation holds.
Key difference: macro risk is elevated. Iran tensions aren’t resolved, and tariff uncertainty lingers. A single geopolitical shock could override every bullish on-chain signal overnight.
On-chain scorecard (4 of 6 bullish)
- ✅ Exchange reserves: declining (-1.01M ETH in 30d) – supply squeeze building
- ✅ ETF flows: +$187M weekly, strongest of 2026
- ✅ Network activity: +41% w/w – usage surge
- ✅ ETH/BTC ratio: 0.0305 → 0.0312, recovering from five-year floor
- ⚠️ Leverage ratio: 0.954, climbing from 0.908 – overheating risk
- ⚠️ ATH distance: -53% ($4,946) – long road ahead
TokenEcho verdict
Direction: Cautiously bullish
Key level: $2,400 – today’s 24h high hit $2,401 and got rejected. A clean break with volume above $30B confirms the rotation trade.
Risk factor: Leverage ratio approaching the 0.97 level that triggered the last flush on April 1-2. If BTC ETF outflows intensify rather than stabilize, the rotation thesis crumbles.
This is an analytical assessment, not financial advice.
What to watch next 48-72 hours
- $2,400 breakout with daily volume above $30B → confirms rotation trade, targets $2,500 resistance
- BTC ETF flow reversal – if institutional BTC inflows resume, the rotation narrative fades and ETH likely underperforms again
- Leverage ratio crossing 0.97 without a price breakout → elevated liquidation risk, watch for a pullback to $2,200 support
This analysis is part of our daily Ethereum price tracking. See all previous analyses and key metrics on our hub page.
For long-term targets, see our Ethereum price prediction 2026-2030. And for today’s Bitcoin price analysis – the other side of the rotation trade – check our BTC hub.
The ETF money says ETH. The leverage says caution. Which signal breaks first will define whether this rotation has legs – or gets flushed like the last one.
This is not financial advice. DYOR. Data as of April 14, 2026.
Sources: CoinGecko API, CryptoQuant, Farside Investors ETH ETF Tracker, CoinDesk, Standard Chartered Research
Leave a Reply