
🕑 7 min read
The longest period of extreme fear since Terra-LUNA just snapped – but rising leverage and early profit-taking signal the rally isn’t free of risk.
Bitcoin’s worst sentiment streak since 2022 is officially over. And the recovery has already delivered nearly 10% in a single week.
BTC broke above $74,000 on Monday, trading at $74,627 as of April 14, up 4.96% in the past 24 hours. This bitcoin price analysis breaks down what triggered the rally, what the on-chain data actually says about its sustainability, and where the risks are hiding.
Key Takeaways
- The Fear & Greed index jumped from 8 to 53 – ending a 46-day extreme fear streak, the longest since the Terra-LUNA collapse in 2022. BTC surged 9.2% in a week to hit a four-week high above $74K.
- ETFs absorbed $1.1 billion in weekly inflows (strongest since January), while Strategy added 13,927 BTC (~$1 billion). Exchange reserves dropped to 2,692,139 BTC – their lowest this cycle – as nearly 12,000 BTC ($889 million) left exchanges in six days.
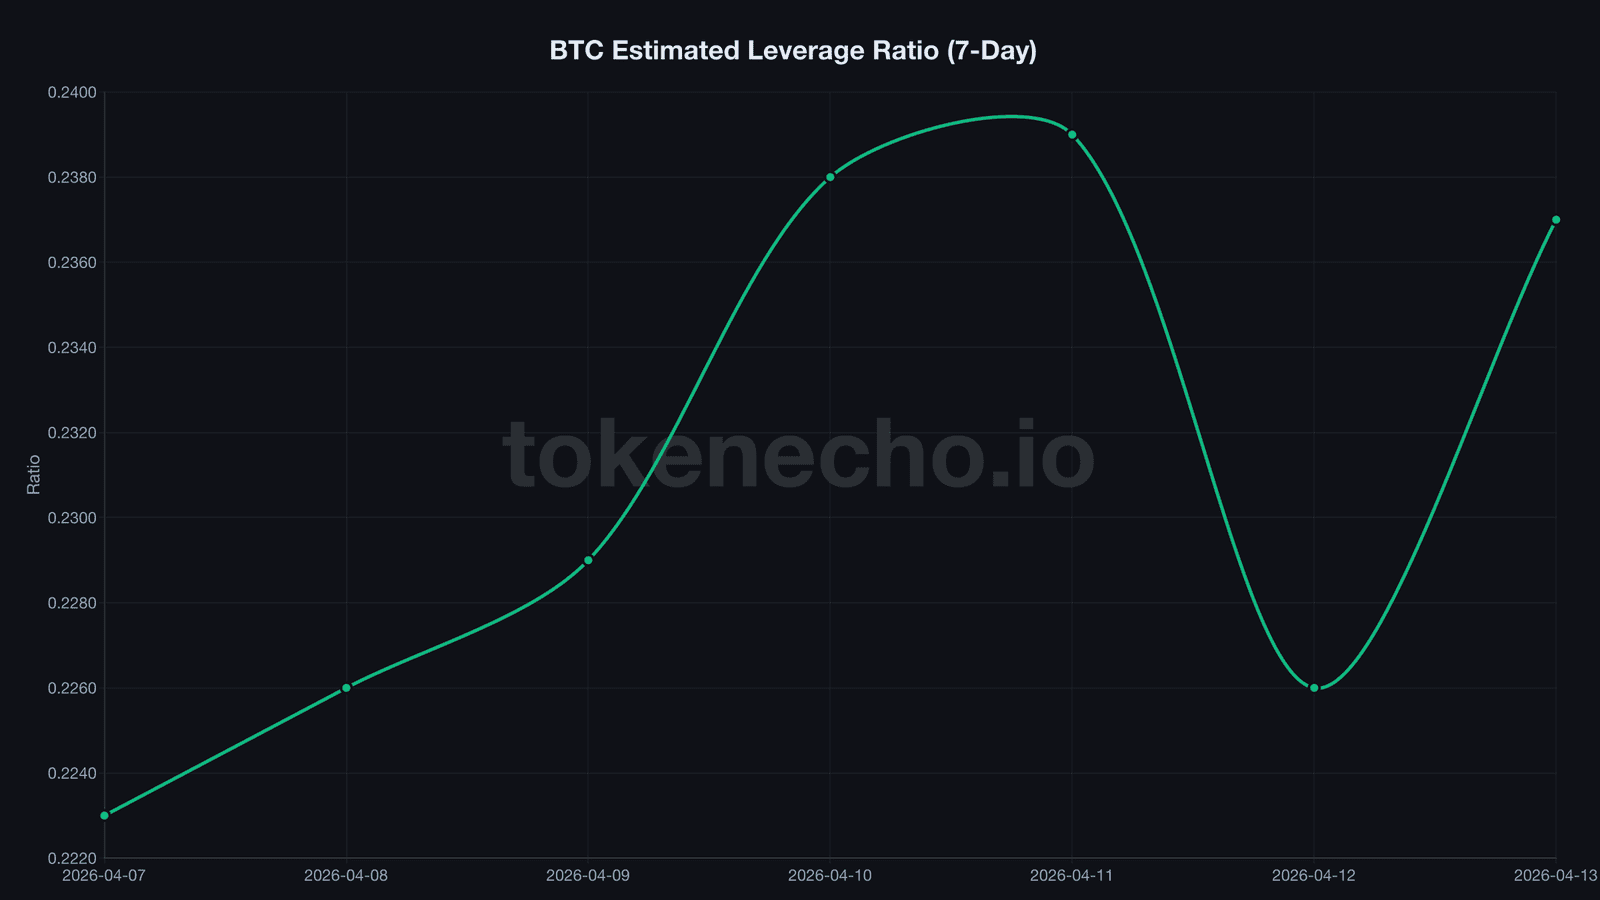
- Leverage ratio climbed from 0.223 to 0.237 – its highest since late March – and today’s exchange netflow turned positive at +4,246 BTC. The rally needs spot buyers, not leveraged longs, to hold.
46 days of extreme fear – and then it wasn’t
Forty-six days.
That’s how long the Fear & Greed index sat below 25 – stuck in single digits and low teens, a stretch not seen since the Terra-LUNA meltdown of 2022. The reading bottomed at 8 out of 100, one of the most extreme prints ever recorded.
Then it snapped.
Between April 7 and April 13, the index leaped from 8 to 53, flipping from extreme fear straight into greed territory. BTC surged from $68,587 to $74,627, fueled by Iran’s push for a deal with the US and the strongest ETF demand in three months.
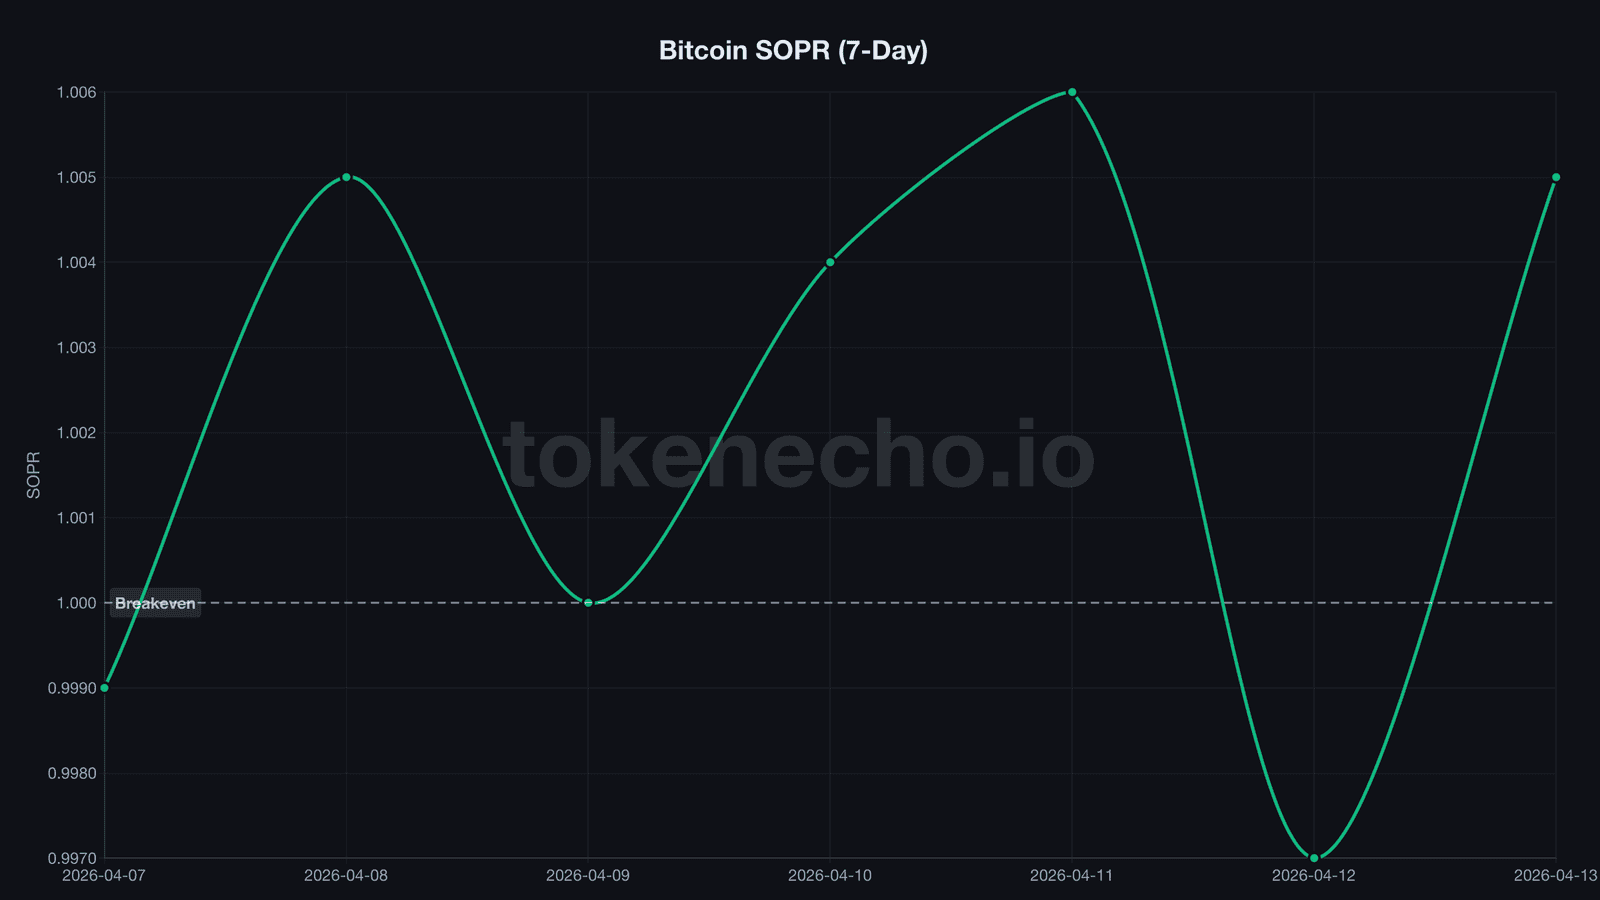
SOPR, the spent output profit ratio that tracks whether sellers are booking gains or losses, finally stabilized above 1.0 after spending 13 consecutive days below breakeven. Sellers collectively accepted losses for nearly two weeks straight before the market turned. That kind of sustained capitulation grinds through weak hands – and eventually runs out of sellers.
But the real signal is buried in the long-term holder data.
LTH-SOPR, which tracks only coins held for 155 or more days, cratered to 0.820 on April 8 – meaning the average long-term holder who sold that day was locking in an 18% loss on coins they’d held through an entire market cycle. Five days later? It snapped to 1.228. A swing from deep capitulation to comfortable profit that we haven’t seen since the post-FTX bottom.
The crypto market loves to overreact in both directions. But a sentiment index that nearly sextupled in under a week isn’t overreaction – it’s like a packed theater suddenly realizing the fire alarm was a false alarm and stampeding back to their seats.
$1.1B in ETF inflows while retail panicked
Most retail traders ran for the exits during those 46 days. Institutions did the exact opposite.
Spot Bitcoin ETFs pulled in $1.1 billion in the week ending April 13 – the strongest weekly demand since January 2026. BlackRock’s IBIT led with $871 million. Morgan Stanley’s freshly launched MSBT, priced at a competitive 0.14% expense ratio that undercuts BlackRock’s 0.25%, started chipping away at its rival’s dominance from day one.
And then there’s Strategy.
“@Strategy has acquired 13,927 BTC for ~$1.03 billion at ~$74,463 per bitcoin,” Michael Saylor, Executive Chairman of Strategy, said on X. That brings the company’s total stash to roughly 780,897 BTC – more than 3.9% of Bitcoin’s entire circulating supply sitting in a single corporate treasury.
So who was actually selling during the panic? Not the institutions. Not the whales.
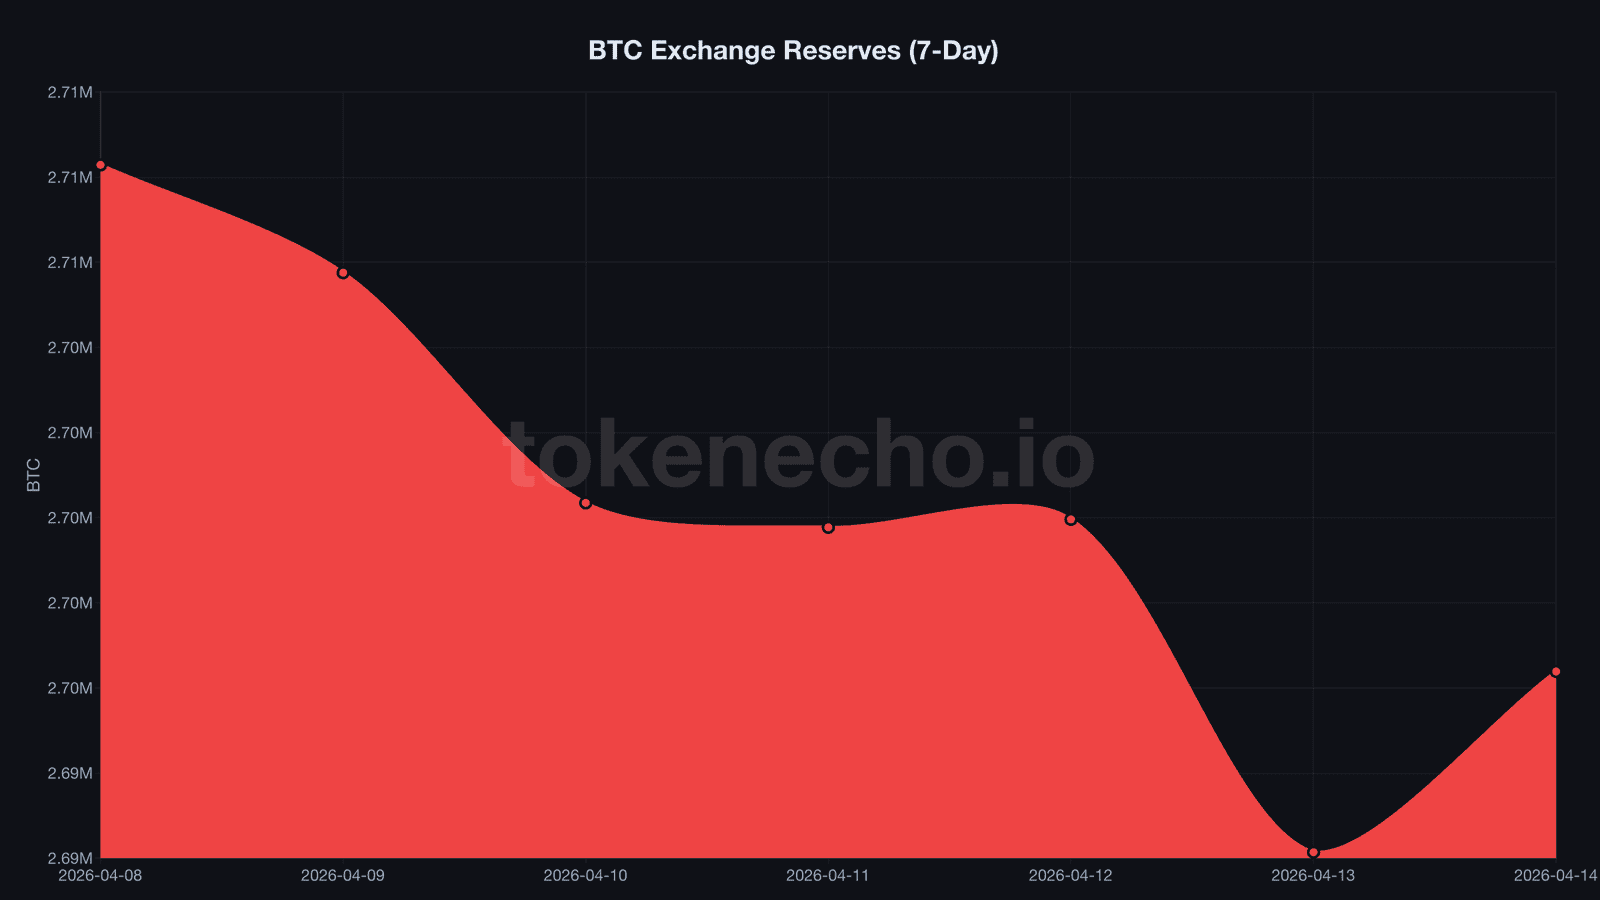
Exchange reserves tell the same story from a different angle. Between April 8 and April 14, roughly 12,000 BTC – about $889 million – quietly drained from exchanges. Reserves hit 2,692,139 BTC on April 13, the lowest reading this cycle. Coins leaving exchanges at this pace means they’re heading into cold storage or institutional custody.
Sellers aren’t restocking. They’re exhausted.
We’ve watched 48 days of panic pricing. And the big players used every single one of those days to accumulate.
Leverage creeps back – the $74K rally’s weak spot
Has the all-clear sounded? Not quite.
The estimated leverage ratio, which compares open interest to exchange reserves and tends to spike right before liquidation cascades, rose from 0.223 on April 7 to 0.237 on April 13 – a 6.3% jump in six days that brings it uncomfortably close to the level that preceded the late-March flush from $72K to $66K.
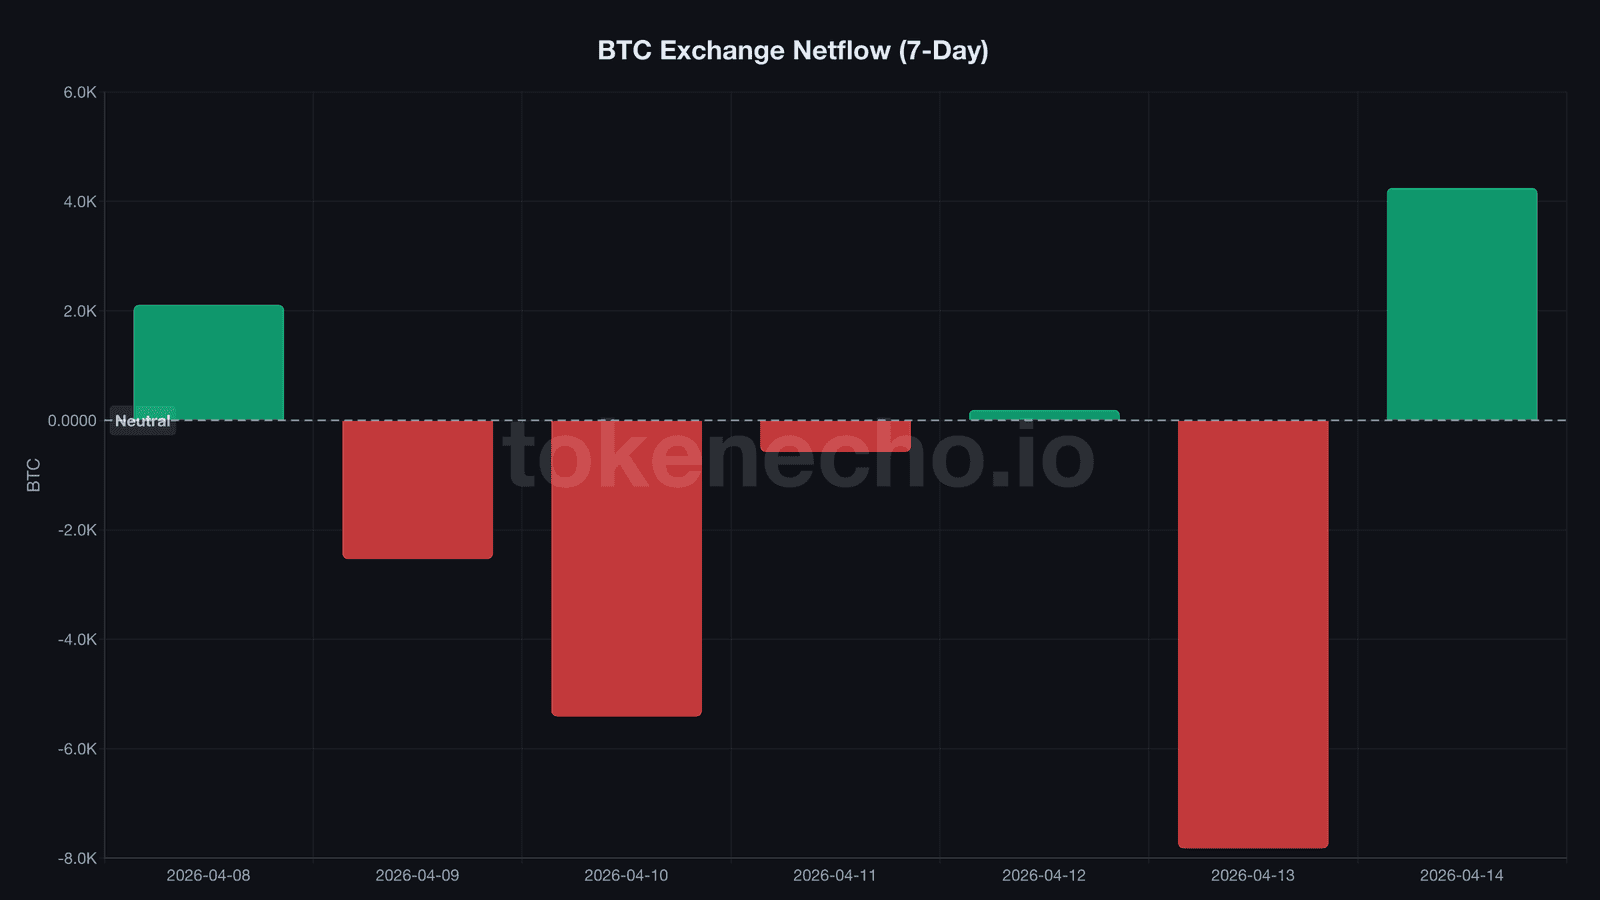
Today’s exchange netflow flashed its first warning.
After six straight days of net outflows, exchanges saw +4,246 BTC flow back in. Not massive. But directionally significant. Early profit-taking – or leveraged shorts positioning for a pullback.
NUPL, the net unrealized profit/loss ratio that measures how much of the network sits in profit, climbed to 0.272. Technically that’s the “optimism” zone, up from 0.234 just two days ago. But it’s nowhere near the 0.5+ levels that define confirmed bull markets. We’re in no-man’s-land.
MVRV, which compares market value to realized value – effectively the aggregate cost basis of all coins on the network – sits at 1.374. It bottomed at 1.306 on April 12 and peaked above 3.7 during the October 2025 ATH. The market’s priced 37% above realized value. Enough room to rally, but not enough cushion to absorb a leverage flush.
The last time fear flipped this fast, BTC doubled
The comparison everyone’s thinking about: November 2022.
The last time the Fear & Greed index spent 40+ consecutive days in extreme fear and then reversed, BTC sat at $16,000. FTX had just imploded. Every headline screamed “crypto is dead.”
Within 90 days, Bitcoin climbed from $16,500 to $25,000 – a 52% rally. By April 2023, it’d crossed $30,000. Market analysts estimate that every historical instance of Fear & Greed dropping below 10 has produced an average 90-day return of roughly +48%.
Does the current setup rhyme? Partially.
The accumulation pattern is strikingly similar. ETFs didn’t exist in 2022, but OTC desks and whale wallets showed the same “buy the panic” behavior. Exchange reserves declined steadily through both periods. And LTH-SOPR hit similarly extreme levels – 0.681 in March 2026 vs. 0.55 during the FTX capitulation.
The key difference: in 2022, the Fed was aggressively hiking rates into a recession scare. Today, oil just crashed 15% on the Iran ceasefire, reducing inflationary pressure and cracking open the door for dovish policy. The macro backdrop is friendlier.
But BTC still needs to rally 69% from $74,627 to reclaim its $126,080 ATH. That’s a long road – even with a billion dollars a week flowing into ETFs.
Data comparison
| Metric | Today (Apr 14) | 7d ago (Apr 7) | ~30d ago (mid-Mar) | Signal |
|---|---|---|---|---|
| Price | $74,627 | $68,587 | ~$71,843 | ▲ Bullish |
| SOPR | 1.005 | 0.999 | ~1.01 | ▲ Bullish |
| MVRV | 1.374 | 1.328 | ~1.35 | ▲ Bullish |
| NUPL | 0.272 | 0.247 | ~0.27 | ▲ Bullish |
| Exchange Reserves | 2,696,385 BTC | 2,708,287 BTC | ~2,710,000 BTC | ▲ Bullish |
| Leverage Ratio | 0.237 | 0.223 | ~0.235 | ⚠️ Caution |
| Puell Multiple | 0.754 | 0.674 | ~0.78 | — Neutral |
On-chain scorecard (4 of 6 bullish)
- ✅ SOPR (1.005): Above breakeven – sellers profitable after 13-day bleed
- ✅ Exchange Reserves (2,692,139 BTC): Cycle low, sustained outflows over six days
- ✅ NUPL (0.272): Transitioned from Fear into early Optimism zone
- ✅ ETF Flows (+$1.1B weekly): Strongest institutional demand since January 2026
- ⚠️ Leverage Ratio (0.237): Climbing from 0.223, near the level that preceded late-March flush
- ⚠️ Exchange Netflow (+4,246 BTC today): First positive day in six – early profit-taking signal
TokenEcho Verdict
Direction: Cautiously bullish
The fear-to-greed flip, massive ETF inflows, and declining exchange reserves paint a constructive picture. But leverage building without a corresponding increase in spot volume keeps this from being a full reversal call.
Key level: $76,000. A daily close above it with volume exceeding $60 billion would confirm the breakout and open the path toward $80K.
Risk factor: Leverage ratio crossing 0.24 without spot volume support could trigger a liquidation cascade back to $70K – the same pattern that played out in late March.
This is an analytical assessment, not financial advice.
What to watch in the next 72 hours
- $76K breakout with daily volume above $60B – bullish confirmation, next target the $80K resistance cluster
- Leverage ratio above 0.24 without spot volume increase – liquidation risk, possible flush to $70K
- Iran deal resolution: a permanent agreement would be structurally risk-on for all assets; collapse of talks could unwind this rally overnight
This analysis is part of our daily Bitcoin price tracking. See all previous analyses and key metrics on our hub page.
If you’re watching the long-term BTC outlook, this week’s data shifts the near-term picture – but the leverage buildup and macro uncertainty leave the bigger question open.
ETF money says one thing. The leverage chart says another. Which side breaks first will define whether $74K was a floor or a ceiling.
This is not financial advice. DYOR. Data as of April 14, 2026.
Sources:
- CoinGecko (price, market cap, volume, supply)
- CryptoQuant (SOPR, MVRV, NUPL, exchange reserves, netflow, leverage ratio, Puell Multiple)
- alternative.me (Fear & Greed Index)
- Farside Investors (ETF flow data)
- Strategy SEC 8-K filings (BTC purchase disclosures)
Leave a Reply